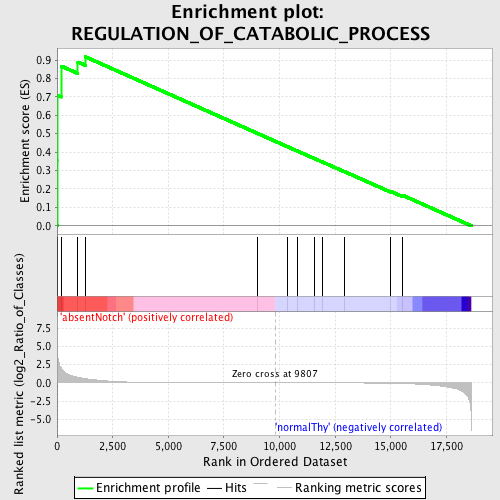
Profile of the Running ES Score & Positions of GeneSet Members on the Rank Ordered List
| Dataset | Set_03_absentNotch_versus_normalThy.phenotype_absentNotch_versus_normalThy.cls #absentNotch_versus_normalThy.phenotype_absentNotch_versus_normalThy.cls #absentNotch_versus_normalThy_repos |
| Phenotype | phenotype_absentNotch_versus_normalThy.cls#absentNotch_versus_normalThy_repos |
| Upregulated in class | absentNotch |
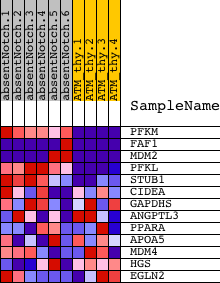
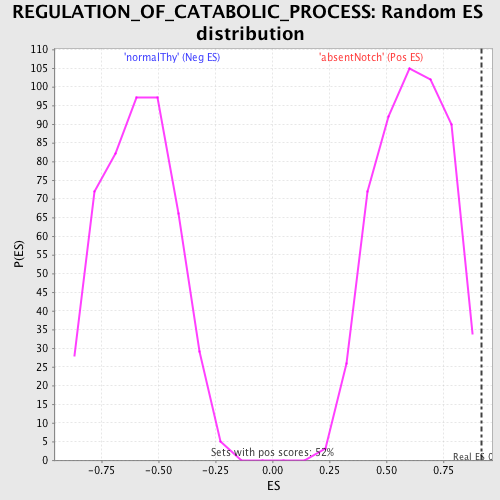
| GeneSet | REGULATION_OF_CATABOLIC_PROCESS |
| Enrichment Score (ES) | 0.91728157 |
| Normalized Enrichment Score (NES) | 1.4949292 |
| Nominal p-value | 0.005725191 |
| FDR q-value | 0.361609 |
| FWER p-Value | 0.997 |
| PROBE | DESCRIPTION (from dataset) | GENE SYMBOL | GENE_TITLE | RANK IN GENE LIST | RANK METRIC SCORE | RUNNING ES | CORE ENRICHMENT | |
|---|---|---|---|---|---|---|---|---|
| 1 | PFKM | 1990156 5720168 | 15 | 4.372 | 0.3573 | Yes | ||
| 2 | FAF1 | 2450717 2510121 4730156 | 17 | 4.283 | 0.7080 | Yes | ||
| 3 | MDM2 | 3450053 5080138 | 179 | 2.052 | 0.8674 | Yes | ||
| 4 | PFKL | 6200167 | 934 | 0.759 | 0.8890 | Yes | ||
| 5 | STUB1 | 5860086 | 1275 | 0.569 | 0.9173 | Yes | ||
| 6 | CIDEA | 4560020 | 9000 | 0.002 | 0.5023 | No | ||
| 7 | GAPDHS | 2690463 | 10367 | -0.002 | 0.4290 | No | ||
| 8 | ANGPTL3 | 6180497 | 10815 | -0.003 | 0.4052 | No | ||
| 9 | PPARA | 2060026 | 11546 | -0.005 | 0.3664 | No | ||
| 10 | APOA5 | 6130471 | 11913 | -0.007 | 0.3473 | No | ||
| 11 | MDM4 | 4070504 4780008 | 12896 | -0.012 | 0.2955 | No | ||
| 12 | HGS | 5570722 | 14996 | -0.052 | 0.1869 | No | ||
| 13 | EGLN2 | 540086 | 15541 | -0.093 | 0.1653 | No |