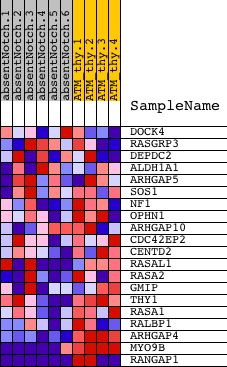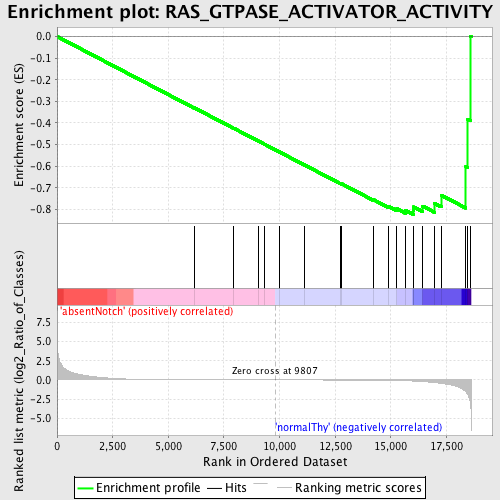
Profile of the Running ES Score & Positions of GeneSet Members on the Rank Ordered List
| Dataset | Set_03_absentNotch_versus_normalThy.phenotype_absentNotch_versus_normalThy.cls #absentNotch_versus_normalThy.phenotype_absentNotch_versus_normalThy.cls #absentNotch_versus_normalThy_repos |
| Phenotype | phenotype_absentNotch_versus_normalThy.cls#absentNotch_versus_normalThy_repos |
| Upregulated in class | normalThy |
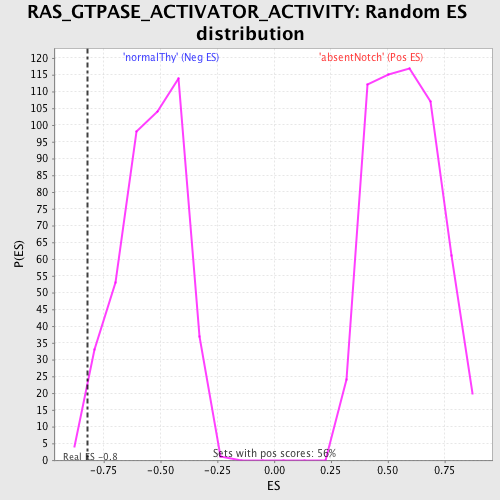
| GeneSet | RAS_GTPASE_ACTIVATOR_ACTIVITY |
| Enrichment Score (ES) | -0.8233496 |
| Normalized Enrichment Score (NES) | -1.5217444 |
| Nominal p-value | 0.015765766 |
| FDR q-value | 0.56221056 |
| FWER p-Value | 0.993 |
| PROBE | DESCRIPTION (from dataset) | GENE SYMBOL | GENE_TITLE | RANK IN GENE LIST | RANK METRIC SCORE | RUNNING ES | CORE ENRICHMENT | |
|---|---|---|---|---|---|---|---|---|
| 1 | DOCK4 | 5910102 | 6166 | 0.014 | -0.3299 | No | ||
| 2 | RASGRP3 | 6020504 | 7949 | 0.005 | -0.4250 | No | ||
| 3 | DEPDC2 | 5220102 | 9068 | 0.002 | -0.4849 | No | ||
| 4 | ALDH1A1 | 6520706 | 9306 | 0.001 | -0.4975 | No | ||
| 5 | ARHGAP5 | 2510619 3360035 | 9989 | -0.001 | -0.5341 | No | ||
| 6 | SOS1 | 7050338 | 11108 | -0.004 | -0.5937 | No | ||
| 7 | NF1 | 6980433 | 12719 | -0.011 | -0.6790 | No | ||
| 8 | OPHN1 | 2360100 | 12798 | -0.011 | -0.6818 | No | ||
| 9 | ARHGAP10 | 510086 780324 | 14213 | -0.026 | -0.7546 | No | ||
| 10 | CDC42EP2 | 540079 2970138 | 14905 | -0.047 | -0.7860 | No | ||
| 11 | CENTD2 | 60408 2510156 6100494 | 15271 | -0.070 | -0.7970 | No | ||
| 12 | RASAL1 | 3710112 | 15662 | -0.106 | -0.8049 | No | ||
| 13 | RASA2 | 7100706 | 16007 | -0.143 | -0.8057 | Yes | ||
| 14 | GMIP | 6980193 | 16021 | -0.145 | -0.7885 | Yes | ||
| 15 | THY1 | 5910162 | 16422 | -0.209 | -0.7842 | Yes | ||
| 16 | RASA1 | 1240315 | 16954 | -0.335 | -0.7716 | Yes | ||
| 17 | RALBP1 | 4780632 | 17268 | -0.439 | -0.7343 | Yes | ||
| 18 | ARHGAP4 | 1940022 | 18372 | -1.547 | -0.6031 | Yes | ||
| 19 | MYO9B | 1230435 3060358 | 18459 | -1.822 | -0.3833 | Yes | ||
| 20 | RANGAP1 | 2320593 6650601 | 18583 | -3.180 | 0.0018 | Yes |