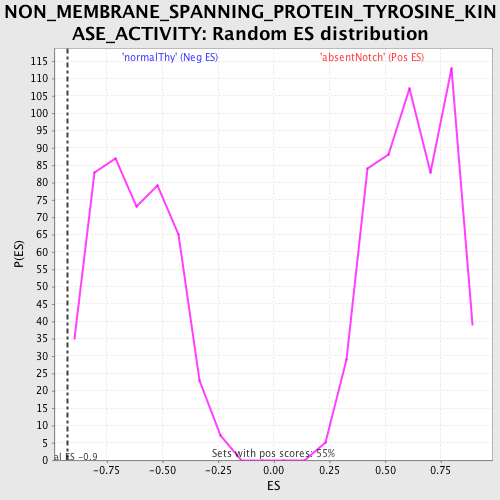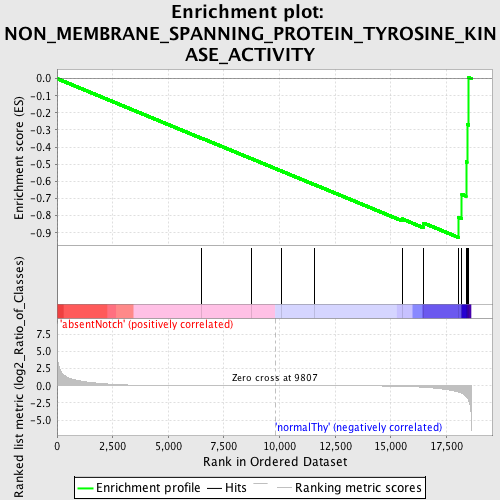
Profile of the Running ES Score & Positions of GeneSet Members on the Rank Ordered List
| Dataset | Set_03_absentNotch_versus_normalThy.phenotype_absentNotch_versus_normalThy.cls #absentNotch_versus_normalThy.phenotype_absentNotch_versus_normalThy.cls #absentNotch_versus_normalThy_repos |
| Phenotype | phenotype_absentNotch_versus_normalThy.cls#absentNotch_versus_normalThy_repos |
| Upregulated in class | normalThy |
| GeneSet | NON_MEMBRANE_SPANNING_PROTEIN_TYROSINE_KINASE_ACTIVITY |
| Enrichment Score (ES) | -0.927487 |
| Normalized Enrichment Score (NES) | -1.4775726 |
| Nominal p-value | 0.0022123894 |
| FDR q-value | 0.4980604 |
| FWER p-Value | 1.0 |
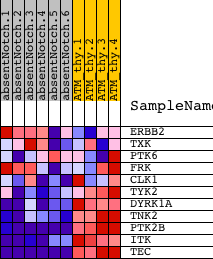
| PROBE | DESCRIPTION (from dataset) | GENE SYMBOL | GENE_TITLE | RANK IN GENE LIST | RANK METRIC SCORE | RUNNING ES | CORE ENRICHMENT | |
|---|---|---|---|---|---|---|---|---|
| 1 | ERBB2 | 3830673 | 6491 | 0.012 | -0.3474 | No | ||
| 2 | TXK | 2320338 | 8749 | 0.003 | -0.4683 | No | ||
| 3 | PTK6 | 6860735 | 10096 | -0.001 | -0.5405 | No | ||
| 4 | FRK | 5130333 | 11583 | -0.005 | -0.6197 | No | ||
| 5 | CLK1 | 1780551 2100102 2340347 2480347 | 15507 | -0.089 | -0.8192 | No | ||
| 6 | TYK2 | 1660465 1740736 | 16473 | -0.219 | -0.8432 | Yes | ||
| 7 | DYRK1A | 3190181 | 18042 | -0.921 | -0.8102 | Yes | ||
| 8 | TNK2 | 1570390 | 18194 | -1.119 | -0.6757 | Yes | ||
| 9 | PTK2B | 4730411 | 18382 | -1.574 | -0.4853 | Yes | ||
| 10 | ITK | 2230592 | 18426 | -1.732 | -0.2670 | Yes | ||
| 11 | TEC | 1400576 | 18505 | -2.176 | 0.0060 | Yes |