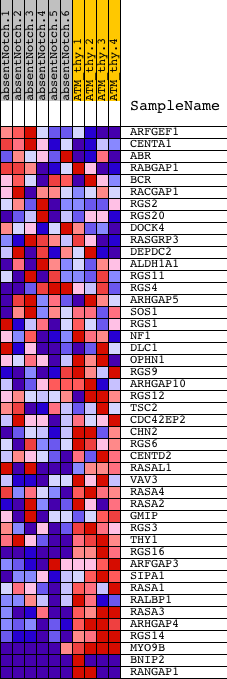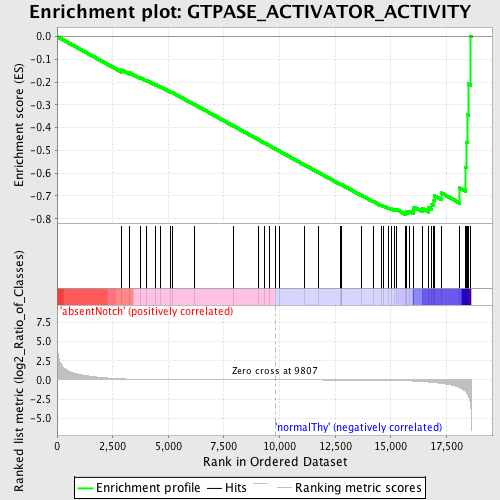
Profile of the Running ES Score & Positions of GeneSet Members on the Rank Ordered List
| Dataset | Set_03_absentNotch_versus_normalThy.phenotype_absentNotch_versus_normalThy.cls #absentNotch_versus_normalThy.phenotype_absentNotch_versus_normalThy.cls #absentNotch_versus_normalThy_repos |
| Phenotype | phenotype_absentNotch_versus_normalThy.cls#absentNotch_versus_normalThy_repos |
| Upregulated in class | normalThy |
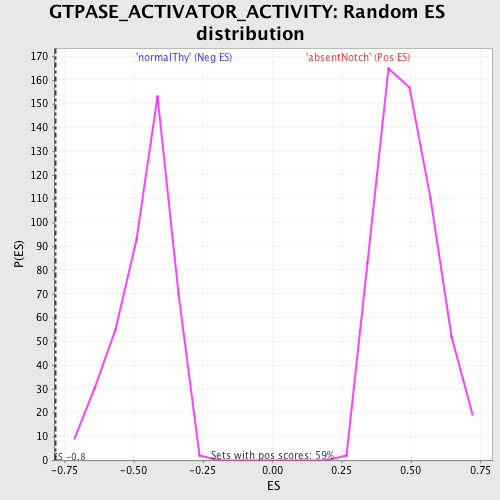
| GeneSet | GTPASE_ACTIVATOR_ACTIVITY |
| Enrichment Score (ES) | -0.78129005 |
| Normalized Enrichment Score (NES) | -1.7046173 |
| Nominal p-value | 0.0 |
| FDR q-value | 0.09380581 |
| FWER p-Value | 0.097 |
| PROBE | DESCRIPTION (from dataset) | GENE SYMBOL | GENE_TITLE | RANK IN GENE LIST | RANK METRIC SCORE | RUNNING ES | CORE ENRICHMENT | |
|---|---|---|---|---|---|---|---|---|
| 1 | ARFGEF1 | 6760494 | 2901 | 0.139 | -0.1468 | No | ||
| 2 | CENTA1 | 2360128 5220037 | 3240 | 0.103 | -0.1581 | No | ||
| 3 | ABR | 610079 1170609 3610195 5670050 | 3737 | 0.068 | -0.1802 | No | ||
| 4 | RABGAP1 | 5050397 | 4021 | 0.053 | -0.1919 | No | ||
| 5 | BCR | 2260020 4230180 6040195 | 4419 | 0.039 | -0.2107 | No | ||
| 6 | RACGAP1 | 3990162 6620736 | 4654 | 0.032 | -0.2211 | No | ||
| 7 | RGS2 | 1090736 | 5084 | 0.024 | -0.2425 | No | ||
| 8 | RGS20 | 4540541 4730086 | 5174 | 0.023 | -0.2457 | No | ||
| 9 | DOCK4 | 5910102 | 6166 | 0.014 | -0.2982 | No | ||
| 10 | RASGRP3 | 6020504 | 7949 | 0.005 | -0.3938 | No | ||
| 11 | DEPDC2 | 5220102 | 9068 | 0.002 | -0.4538 | No | ||
| 12 | ALDH1A1 | 6520706 | 9306 | 0.001 | -0.4665 | No | ||
| 13 | RGS11 | 2360041 | 9565 | 0.001 | -0.4803 | No | ||
| 14 | RGS4 | 2970711 | 9811 | -0.000 | -0.4935 | No | ||
| 15 | ARHGAP5 | 2510619 3360035 | 9989 | -0.001 | -0.5030 | No | ||
| 16 | SOS1 | 7050338 | 11108 | -0.004 | -0.5630 | No | ||
| 17 | RGS1 | 4060347 4540181 | 11770 | -0.006 | -0.5981 | No | ||
| 18 | NF1 | 6980433 | 12719 | -0.011 | -0.6485 | No | ||
| 19 | DLC1 | 1090632 6450594 | 12761 | -0.011 | -0.6499 | No | ||
| 20 | OPHN1 | 2360100 | 12798 | -0.011 | -0.6511 | No | ||
| 21 | RGS9 | 1050273 | 13671 | -0.018 | -0.6968 | No | ||
| 22 | ARHGAP10 | 510086 780324 | 14213 | -0.026 | -0.7242 | No | ||
| 23 | RGS12 | 1190082 5390369 | 14559 | -0.034 | -0.7405 | No | ||
| 24 | TSC2 | 1450494 | 14686 | -0.038 | -0.7447 | No | ||
| 25 | CDC42EP2 | 540079 2970138 | 14905 | -0.047 | -0.7533 | No | ||
| 26 | CHN2 | 870528 | 15031 | -0.054 | -0.7564 | No | ||
| 27 | RGS6 | 6040601 | 15152 | -0.061 | -0.7587 | No | ||
| 28 | CENTD2 | 60408 2510156 6100494 | 15271 | -0.070 | -0.7603 | No | ||
| 29 | RASAL1 | 3710112 | 15662 | -0.106 | -0.7741 | Yes | ||
| 30 | VAV3 | 1050731 2450242 2680653 | 15696 | -0.110 | -0.7684 | Yes | ||
| 31 | RASA4 | 110296 4200114 | 15816 | -0.123 | -0.7665 | Yes | ||
| 32 | RASA2 | 7100706 | 16007 | -0.143 | -0.7671 | Yes | ||
| 33 | GMIP | 6980193 | 16021 | -0.145 | -0.7579 | Yes | ||
| 34 | RGS3 | 60670 540736 1340180 1500369 3390735 4010131 4610402 6380114 | 16039 | -0.149 | -0.7488 | Yes | ||
| 35 | THY1 | 5910162 | 16422 | -0.209 | -0.7552 | Yes | ||
| 36 | RGS16 | 780091 | 16708 | -0.272 | -0.7521 | Yes | ||
| 37 | ARFGAP3 | 3390717 | 16848 | -0.306 | -0.7389 | Yes | ||
| 38 | SIPA1 | 5220687 | 16935 | -0.330 | -0.7212 | Yes | ||
| 39 | RASA1 | 1240315 | 16954 | -0.335 | -0.6996 | Yes | ||
| 40 | RALBP1 | 4780632 | 17268 | -0.439 | -0.6867 | Yes | ||
| 41 | RASA3 | 2060465 | 18096 | -0.982 | -0.6648 | Yes | ||
| 42 | ARHGAP4 | 1940022 | 18372 | -1.547 | -0.5749 | Yes | ||
| 43 | RGS14 | 380086 | 18399 | -1.661 | -0.4640 | Yes | ||
| 44 | MYO9B | 1230435 3060358 | 18459 | -1.822 | -0.3439 | Yes | ||
| 45 | BNIP2 | 1410475 6770088 | 18487 | -2.026 | -0.2083 | Yes | ||
| 46 | RANGAP1 | 2320593 6650601 | 18583 | -3.180 | 0.0018 | Yes |