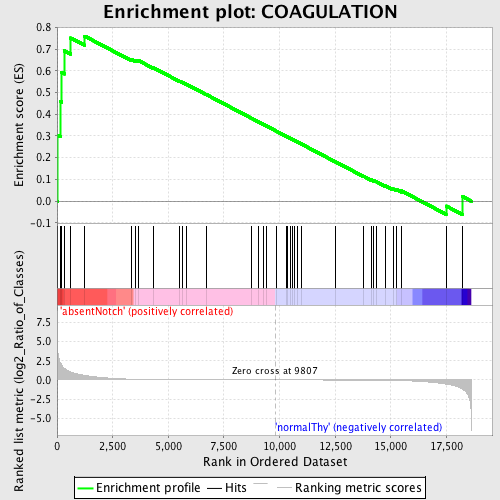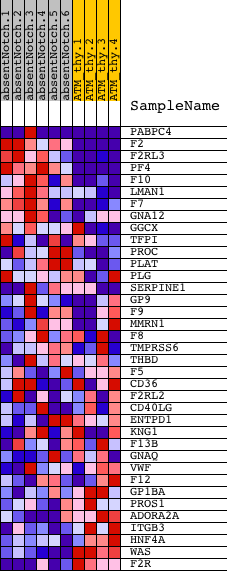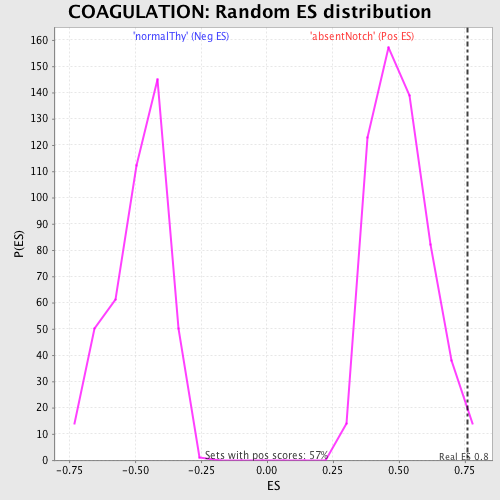
Profile of the Running ES Score & Positions of GeneSet Members on the Rank Ordered List
| Dataset | Set_03_absentNotch_versus_normalThy.phenotype_absentNotch_versus_normalThy.cls #absentNotch_versus_normalThy.phenotype_absentNotch_versus_normalThy.cls #absentNotch_versus_normalThy_repos |
| Phenotype | phenotype_absentNotch_versus_normalThy.cls#absentNotch_versus_normalThy_repos |
| Upregulated in class | absentNotch |
| GeneSet | COAGULATION |
| Enrichment Score (ES) | 0.7593539 |
| Normalized Enrichment Score (NES) | 1.499034 |
| Nominal p-value | 0.019400353 |
| FDR q-value | 0.35415286 |
| FWER p-Value | 0.995 |

| PROBE | DESCRIPTION (from dataset) | GENE SYMBOL | GENE_TITLE | RANK IN GENE LIST | RANK METRIC SCORE | RUNNING ES | CORE ENRICHMENT | |
|---|---|---|---|---|---|---|---|---|
| 1 | PABPC4 | 1990170 6760270 5390138 | 20 | 4.232 | 0.3040 | Yes | ||
| 2 | F2 | 5720280 | 145 | 2.239 | 0.4588 | Yes | ||
| 3 | F2RL3 | 5340010 | 208 | 1.879 | 0.5909 | Yes | ||
| 4 | PF4 | 6130332 | 320 | 1.486 | 0.6921 | Yes | ||
| 5 | F10 | 3830450 | 609 | 1.030 | 0.7508 | Yes | ||
| 6 | LMAN1 | 3420068 | 1238 | 0.587 | 0.7594 | Yes | ||
| 7 | F7 | 5080411 | 3365 | 0.092 | 0.6516 | No | ||
| 8 | GNA12 | 1230301 | 3521 | 0.080 | 0.6490 | No | ||
| 9 | GGCX | 770377 3990441 | 3675 | 0.071 | 0.6459 | No | ||
| 10 | TFPI | 1400288 5550008 | 4318 | 0.042 | 0.6144 | No | ||
| 11 | PROC | 6520270 | 5515 | 0.019 | 0.5514 | No | ||
| 12 | PLAT | 6860128 | 5621 | 0.018 | 0.5470 | No | ||
| 13 | PLG | 3360270 3840100 | 5826 | 0.016 | 0.5372 | No | ||
| 14 | SERPINE1 | 4210403 | 6716 | 0.010 | 0.4901 | No | ||
| 15 | GP9 | 1190181 | 8757 | 0.003 | 0.3805 | No | ||
| 16 | F9 | 3190154 | 9067 | 0.002 | 0.3640 | No | ||
| 17 | MMRN1 | 7050278 | 9286 | 0.001 | 0.3524 | No | ||
| 18 | F8 | 2190647 2340465 | 9393 | 0.001 | 0.3468 | No | ||
| 19 | TMPRSS6 | 3990095 7050022 | 9868 | -0.000 | 0.3213 | No | ||
| 20 | THBD | 1500092 | 10294 | -0.001 | 0.2985 | No | ||
| 21 | F5 | 1990619 | 10346 | -0.002 | 0.2959 | No | ||
| 22 | CD36 | 5890575 | 10486 | -0.002 | 0.2885 | No | ||
| 23 | F2RL2 | 6110736 | 10586 | -0.002 | 0.2834 | No | ||
| 24 | CD40LG | 3120270 | 10689 | -0.003 | 0.2781 | No | ||
| 25 | ENTPD1 | 7050139 | 10811 | -0.003 | 0.2718 | No | ||
| 26 | KNG1 | 6400576 6770347 | 10994 | -0.003 | 0.2622 | No | ||
| 27 | F13B | 6220278 | 12513 | -0.009 | 0.1812 | No | ||
| 28 | GNAQ | 430670 4210131 5900736 | 13759 | -0.019 | 0.1156 | No | ||
| 29 | VWF | 4670519 | 14118 | -0.025 | 0.0981 | No | ||
| 30 | F12 | 1090215 3520736 | 14238 | -0.027 | 0.0936 | No | ||
| 31 | GP1BA | 6590372 | 14337 | -0.029 | 0.0904 | No | ||
| 32 | PROS1 | 5420465 | 14741 | -0.040 | 0.0716 | No | ||
| 33 | ADORA2A | 1990687 | 15105 | -0.058 | 0.0563 | No | ||
| 34 | ITGB3 | 5270463 | 15243 | -0.068 | 0.0538 | No | ||
| 35 | HNF4A | 6620440 | 15475 | -0.087 | 0.0476 | No | ||
| 36 | WAS | 5270193 | 17487 | -0.535 | -0.0221 | No | ||
| 37 | F2R | 4810180 | 18214 | -1.148 | 0.0216 | No |

