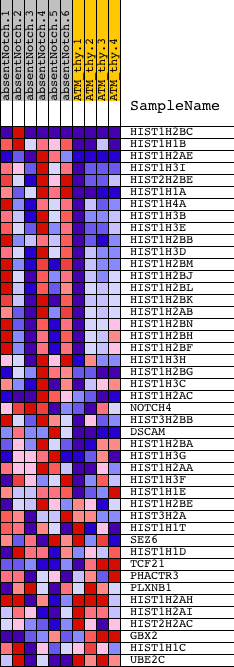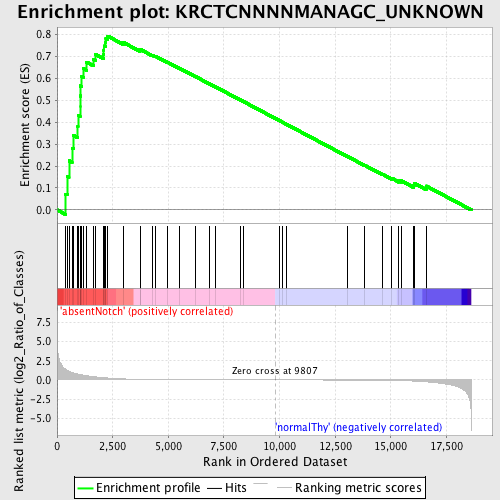
Profile of the Running ES Score & Positions of GeneSet Members on the Rank Ordered List
| Dataset | Set_03_absentNotch_versus_normalThy.phenotype_absentNotch_versus_normalThy.cls #absentNotch_versus_normalThy.phenotype_absentNotch_versus_normalThy.cls #absentNotch_versus_normalThy_repos |
| Phenotype | phenotype_absentNotch_versus_normalThy.cls#absentNotch_versus_normalThy_repos |
| Upregulated in class | absentNotch |
| GeneSet | KRCTCNNNNMANAGC_UNKNOWN |
| Enrichment Score (ES) | 0.79293394 |
| Normalized Enrichment Score (NES) | 1.6256502 |
| Nominal p-value | 0.008576329 |
| FDR q-value | 0.12126994 |
| FWER p-Value | 0.148 |
| PROBE | DESCRIPTION (from dataset) | GENE SYMBOL | GENE_TITLE | RANK IN GENE LIST | RANK METRIC SCORE | RUNNING ES | CORE ENRICHMENT | |
|---|---|---|---|---|---|---|---|---|
| 1 | HIST1H2BC | 2570156 6520315 | 387 | 1.363 | 0.0718 | Yes | ||
| 2 | HIST1H1B | 1410592 | 453 | 1.249 | 0.1531 | Yes | ||
| 3 | HIST1H2AE | 4920672 | 535 | 1.111 | 0.2242 | Yes | ||
| 4 | HIST1H3I | 7100270 | 673 | 0.948 | 0.2812 | Yes | ||
| 5 | HIST2H2BE | 3360184 | 726 | 0.900 | 0.3395 | Yes | ||
| 6 | HIST1H1A | 1450131 | 931 | 0.761 | 0.3803 | Yes | ||
| 7 | HIST1H4A | 1940600 | 940 | 0.755 | 0.4311 | Yes | ||
| 8 | HIST1H3B | 4780092 | 1034 | 0.692 | 0.4731 | Yes | ||
| 9 | HIST1H3E | 840398 | 1036 | 0.692 | 0.5200 | Yes | ||
| 10 | HIST1H2BB | 1340035 | 1050 | 0.685 | 0.5659 | Yes | ||
| 11 | HIST1H3D | 70687 | 1107 | 0.651 | 0.6071 | Yes | ||
| 12 | HIST1H2BM | 3170168 | 1197 | 0.609 | 0.6437 | Yes | ||
| 13 | HIST1H2BJ | 2100551 | 1323 | 0.548 | 0.6742 | Yes | ||
| 14 | HIST1H2BL | 6380070 | 1628 | 0.428 | 0.6869 | Yes | ||
| 15 | HIST1H2BK | 6130433 | 1728 | 0.400 | 0.7087 | Yes | ||
| 16 | HIST1H2AB | 2680465 | 2075 | 0.299 | 0.7104 | Yes | ||
| 17 | HIST1H2BN | 730128 | 2099 | 0.290 | 0.7288 | Yes | ||
| 18 | HIST1H2BH | 2450039 | 2107 | 0.287 | 0.7480 | Yes | ||
| 19 | HIST1H2BF | 5420402 | 2165 | 0.274 | 0.7635 | Yes | ||
| 20 | HIST1H3H | 2760288 | 2193 | 0.267 | 0.7802 | Yes | ||
| 21 | HIST1H2BG | 5670632 | 2272 | 0.250 | 0.7929 | Yes | ||
| 22 | HIST1H3C | 730204 | 2976 | 0.131 | 0.7640 | No | ||
| 23 | HIST1H2AC | 3130292 | 3727 | 0.068 | 0.7282 | No | ||
| 24 | NOTCH4 | 2450040 6370707 | 3758 | 0.066 | 0.7311 | No | ||
| 25 | HIST3H2BB | 70278 | 4289 | 0.043 | 0.7055 | No | ||
| 26 | DSCAM | 1780050 2450731 2810438 | 4405 | 0.039 | 0.7020 | No | ||
| 27 | HIST1H2BA | 2450059 | 4950 | 0.027 | 0.6745 | No | ||
| 28 | HIST1H3G | 5690524 | 5505 | 0.019 | 0.6459 | No | ||
| 29 | HIST1H2AA | 7050100 | 6230 | 0.013 | 0.6079 | No | ||
| 30 | HIST1H3F | 2320441 2480022 3940170 | 6841 | 0.010 | 0.5757 | No | ||
| 31 | HIST1H1E | 6980706 | 7116 | 0.008 | 0.5615 | No | ||
| 32 | HIST1H2BE | 6550053 | 8233 | 0.004 | 0.5017 | No | ||
| 33 | HIST3H2A | 1580504 | 8378 | 0.004 | 0.4942 | No | ||
| 34 | HIST1H1T | 130632 | 9975 | -0.001 | 0.4083 | No | ||
| 35 | SEZ6 | 3450722 | 10151 | -0.001 | 0.3990 | No | ||
| 36 | HIST1H1D | 3440446 | 10299 | -0.001 | 0.3912 | No | ||
| 37 | TCF21 | 2690446 | 13035 | -0.013 | 0.2447 | No | ||
| 38 | PHACTR3 | 3850435 5900445 | 13813 | -0.020 | 0.2043 | No | ||
| 39 | PLXNB1 | 6220273 | 14619 | -0.036 | 0.1633 | No | ||
| 40 | HIST1H2AH | 3710333 | 15047 | -0.055 | 0.1441 | No | ||
| 41 | HIST1H2AI | 4540039 | 15365 | -0.077 | 0.1323 | No | ||
| 42 | HIST2H2AC | 2030600 | 15469 | -0.086 | 0.1326 | No | ||
| 43 | GBX2 | 3940736 | 16022 | -0.146 | 0.1128 | No | ||
| 44 | HIST1H1C | 3870603 | 16052 | -0.150 | 0.1213 | No | ||
| 45 | UBE2C | 6130017 | 16589 | -0.245 | 0.1091 | No |