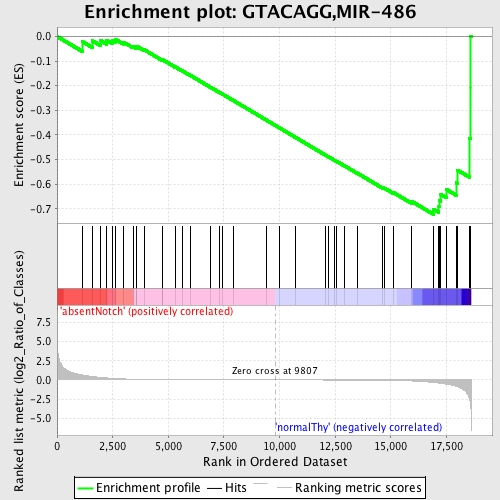
Profile of the Running ES Score & Positions of GeneSet Members on the Rank Ordered List
| Dataset | Set_03_absentNotch_versus_normalThy.phenotype_absentNotch_versus_normalThy.cls #absentNotch_versus_normalThy.phenotype_absentNotch_versus_normalThy.cls #absentNotch_versus_normalThy_repos |
| Phenotype | phenotype_absentNotch_versus_normalThy.cls#absentNotch_versus_normalThy_repos |
| Upregulated in class | normalThy |
| GeneSet | GTACAGG,MIR-486 |
| Enrichment Score (ES) | -0.7233359 |
| Normalized Enrichment Score (NES) | -1.5249742 |
| Nominal p-value | 0.010964912 |
| FDR q-value | 0.16682886 |
| FWER p-Value | 0.679 |
| PROBE | DESCRIPTION (from dataset) | GENE SYMBOL | GENE_TITLE | RANK IN GENE LIST | RANK METRIC SCORE | RUNNING ES | CORE ENRICHMENT | |
|---|---|---|---|---|---|---|---|---|
| 1 | PPP3CB | 6020156 | 1128 | 0.643 | -0.0205 | No | ||
| 2 | CUGBP2 | 6180121 6840139 | 1584 | 0.443 | -0.0172 | No | ||
| 3 | H3F3B | 1410300 | 1955 | 0.329 | -0.0166 | No | ||
| 4 | SNRPD1 | 4480162 | 2229 | 0.258 | -0.0152 | No | ||
| 5 | SFRS3 | 770315 4230593 | 2480 | 0.208 | -0.0156 | No | ||
| 6 | MAP3K7 | 6040068 | 2614 | 0.182 | -0.0113 | No | ||
| 7 | COPS7B | 2970484 4280022 | 2977 | 0.131 | -0.0226 | No | ||
| 8 | NCOA6 | 1780333 6450110 | 3413 | 0.089 | -0.0405 | No | ||
| 9 | SORCS1 | 60411 5890373 | 3556 | 0.078 | -0.0432 | No | ||
| 10 | RBBP6 | 2320129 | 3567 | 0.078 | -0.0389 | No | ||
| 11 | MARK1 | 450484 | 3912 | 0.058 | -0.0538 | No | ||
| 12 | SP5 | 3840309 | 4721 | 0.031 | -0.0954 | No | ||
| 13 | NFAT5 | 2510411 5890195 6550152 | 4733 | 0.031 | -0.0940 | No | ||
| 14 | ARMC8 | 520408 940132 4060368 4210102 | 5298 | 0.021 | -0.1231 | No | ||
| 15 | SFRS1 | 2360440 | 5619 | 0.018 | -0.1392 | No | ||
| 16 | TBX2 | 1990563 | 5988 | 0.015 | -0.1581 | No | ||
| 17 | SLC12A5 | 1980692 | 6881 | 0.009 | -0.2055 | No | ||
| 18 | IRX5 | 2630494 | 7310 | 0.008 | -0.2280 | No | ||
| 19 | PIK3R1 | 4730671 | 7437 | 0.007 | -0.2344 | No | ||
| 20 | GABRB3 | 4150164 | 7909 | 0.006 | -0.2594 | No | ||
| 21 | DCC | 6450438 | 9401 | 0.001 | -0.3396 | No | ||
| 22 | ARHGAP5 | 2510619 3360035 | 9989 | -0.001 | -0.3712 | No | ||
| 23 | GAB2 | 1410280 2340520 4280040 | 10726 | -0.003 | -0.4106 | No | ||
| 24 | DOCK3 | 3290273 3360497 2850068 | 12070 | -0.007 | -0.4825 | No | ||
| 25 | CNTNAP4 | 3830364 5340347 | 12200 | -0.008 | -0.4889 | No | ||
| 26 | NEUROD6 | 4670731 | 12460 | -0.009 | -0.5023 | No | ||
| 27 | ELAVL2 | 360181 | 12551 | -0.010 | -0.5065 | No | ||
| 28 | PDZRN3 | 2340131 | 12912 | -0.012 | -0.5252 | No | ||
| 29 | PUM2 | 4200441 5910446 | 13480 | -0.016 | -0.5547 | No | ||
| 30 | UNC5C | 2640056 | 14624 | -0.036 | -0.6140 | No | ||
| 31 | PTPN12 | 2030309 6020725 6130746 6290609 | 14704 | -0.038 | -0.6158 | No | ||
| 32 | BCORL1 | 1660008 | 15137 | -0.060 | -0.6353 | No | ||
| 33 | AFF3 | 3870102 | 15941 | -0.135 | -0.6701 | No | ||
| 34 | ST5 | 3780204 | 16931 | -0.328 | -0.7028 | Yes | ||
| 35 | PTEN | 3390064 | 17161 | -0.403 | -0.6899 | Yes | ||
| 36 | TOB1 | 4150138 | 17171 | -0.404 | -0.6651 | Yes | ||
| 37 | PIM1 | 630047 | 17249 | -0.433 | -0.6421 | Yes | ||
| 38 | DYNLL1 | 5570113 | 17508 | -0.543 | -0.6220 | Yes | ||
| 39 | STK4 | 2640152 | 17936 | -0.816 | -0.5939 | Yes | ||
| 40 | FOXO1A | 3120670 | 17992 | -0.866 | -0.5427 | Yes | ||
| 41 | FGF13 | 630575 1570440 5360121 | 18542 | -2.538 | -0.4134 | Yes | ||
| 42 | SRF | 70139 2320039 | 18588 | -3.326 | -0.2076 | Yes | ||
| 43 | SMOC1 | 840039 | 18589 | -3.340 | 0.0015 | Yes |

