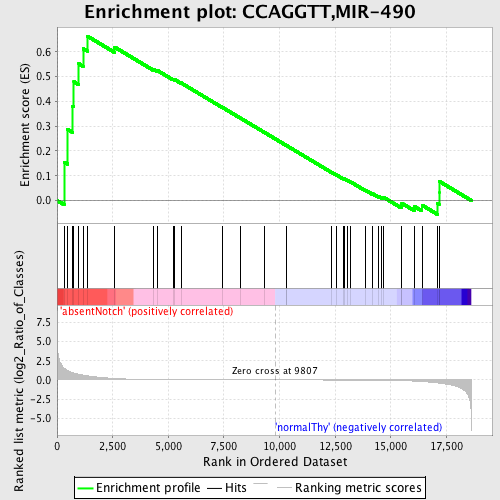
Profile of the Running ES Score & Positions of GeneSet Members on the Rank Ordered List
| Dataset | Set_03_absentNotch_versus_normalThy.phenotype_absentNotch_versus_normalThy.cls #absentNotch_versus_normalThy.phenotype_absentNotch_versus_normalThy.cls #absentNotch_versus_normalThy_repos |
| Phenotype | phenotype_absentNotch_versus_normalThy.cls#absentNotch_versus_normalThy_repos |
| Upregulated in class | absentNotch |
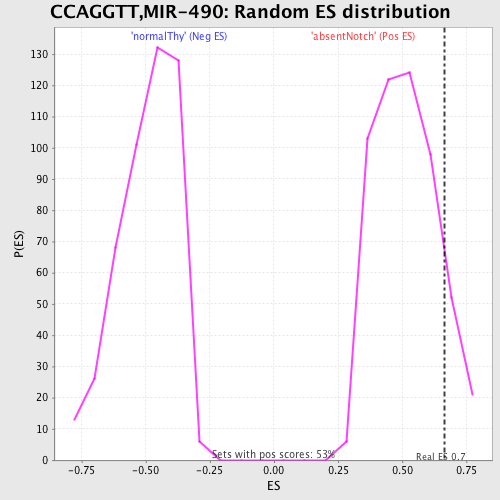
| GeneSet | CCAGGTT,MIR-490 |
| Enrichment Score (ES) | 0.6636513 |
| Normalized Enrichment Score (NES) | 1.2867168 |
| Nominal p-value | 0.11977186 |
| FDR q-value | 1.0 |
| FWER p-Value | 1.0 |
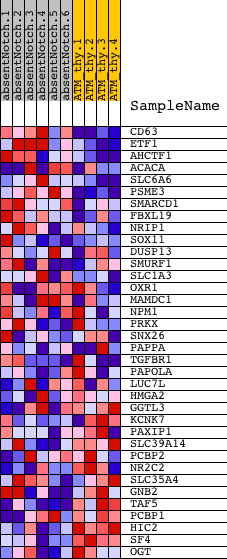
| PROBE | DESCRIPTION (from dataset) | GENE SYMBOL | GENE_TITLE | RANK IN GENE LIST | RANK METRIC SCORE | RUNNING ES | CORE ENRICHMENT | |
|---|---|---|---|---|---|---|---|---|
| 1 | CD63 | 6660451 | 318 | 1.495 | 0.1550 | Yes | ||
| 2 | ETF1 | 6770075 | 472 | 1.218 | 0.2870 | Yes | ||
| 3 | AHCTF1 | 7040100 | 700 | 0.924 | 0.3812 | Yes | ||
| 4 | ACACA | 2490612 2680369 | 755 | 0.877 | 0.4792 | Yes | ||
| 5 | SLC6A6 | 6100300 | 974 | 0.735 | 0.5521 | Yes | ||
| 6 | PSME3 | 2810537 | 1170 | 0.621 | 0.6131 | Yes | ||
| 7 | SMARCD1 | 3060193 3850184 6400369 | 1358 | 0.527 | 0.6637 | Yes | ||
| 8 | FBXL19 | 4570039 | 2587 | 0.188 | 0.6192 | No | ||
| 9 | NRIP1 | 3190039 | 4328 | 0.042 | 0.5303 | No | ||
| 10 | SOX11 | 610279 | 4515 | 0.036 | 0.5245 | No | ||
| 11 | DUSP13 | 6400152 | 5219 | 0.022 | 0.4892 | No | ||
| 12 | SMURF1 | 520609 580647 | 5292 | 0.021 | 0.4878 | No | ||
| 13 | SLC1A3 | 1500070 | 5573 | 0.018 | 0.4748 | No | ||
| 14 | OXR1 | 2370039 3190706 | 7416 | 0.007 | 0.3766 | No | ||
| 15 | MAMDC1 | 3710129 4480075 | 8251 | 0.004 | 0.3322 | No | ||
| 16 | NPM1 | 4730427 | 9338 | 0.001 | 0.2739 | No | ||
| 17 | PRKX | 2480390 2810026 | 10317 | -0.001 | 0.2214 | No | ||
| 18 | SNX26 | 6660215 | 10322 | -0.002 | 0.2214 | No | ||
| 19 | PAPPA | 4230463 | 12352 | -0.009 | 0.1132 | No | ||
| 20 | TGFBR1 | 1400148 4280020 6550711 | 12577 | -0.010 | 0.1023 | No | ||
| 21 | PAPOLA | 4200286 4850112 | 12858 | -0.011 | 0.0885 | No | ||
| 22 | LUC7L | 6040156 6110411 | 12895 | -0.012 | 0.0879 | No | ||
| 23 | HMGA2 | 2940121 3390647 5130279 6400136 | 13058 | -0.013 | 0.0807 | No | ||
| 24 | GGTL3 | 1770288 | 13198 | -0.014 | 0.0748 | No | ||
| 25 | KCNK7 | 4230576 | 13869 | -0.021 | 0.0411 | No | ||
| 26 | PAXIP1 | 4850121 | 14170 | -0.026 | 0.0279 | No | ||
| 27 | SLC39A14 | 670300 1400093 1990711 | 14439 | -0.031 | 0.0171 | No | ||
| 28 | PCBP2 | 5690048 | 14601 | -0.035 | 0.0124 | No | ||
| 29 | NR2C2 | 6100097 | 14667 | -0.037 | 0.0132 | No | ||
| 30 | SLC35A4 | 2940671 | 15473 | -0.086 | -0.0202 | No | ||
| 31 | GNB2 | 2350053 | 15493 | -0.088 | -0.0111 | No | ||
| 32 | TAF5 | 3450288 5890193 6860435 | 16067 | -0.153 | -0.0243 | No | ||
| 33 | PCBP1 | 1050088 | 16401 | -0.205 | -0.0186 | No | ||
| 34 | HIC2 | 4010433 | 17104 | -0.385 | -0.0120 | No | ||
| 35 | SF4 | 3830341 | 17172 | -0.404 | 0.0309 | No | ||
| 36 | OGT | 2360131 4610333 | 17176 | -0.406 | 0.0775 | No |