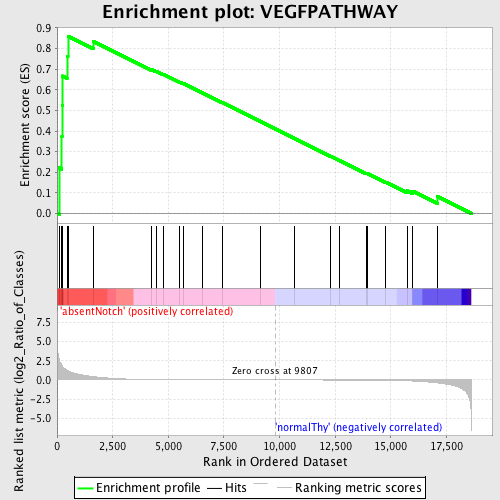
Profile of the Running ES Score & Positions of GeneSet Members on the Rank Ordered List
| Dataset | Set_03_absentNotch_versus_normalThy.phenotype_absentNotch_versus_normalThy.cls #absentNotch_versus_normalThy.phenotype_absentNotch_versus_normalThy.cls #absentNotch_versus_normalThy_repos |
| Phenotype | phenotype_absentNotch_versus_normalThy.cls#absentNotch_versus_normalThy_repos |
| Upregulated in class | absentNotch |
| GeneSet | VEGFPATHWAY |
| Enrichment Score (ES) | 0.860585 |
| Normalized Enrichment Score (NES) | 1.5687052 |
| Nominal p-value | 0.0034305318 |
| FDR q-value | 0.1282676 |
| FWER p-Value | 0.885 |
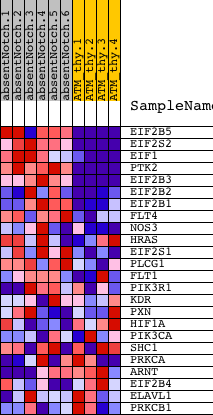
| PROBE | DESCRIPTION (from dataset) | GENE SYMBOL | GENE_TITLE | RANK IN GENE LIST | RANK METRIC SCORE | RUNNING ES | CORE ENRICHMENT | |
|---|---|---|---|---|---|---|---|---|
| 1 | EIF2B5 | 430315 6900400 | 92 | 2.667 | 0.2215 | Yes | ||
| 2 | EIF2S2 | 770095 2810487 | 214 | 1.852 | 0.3722 | Yes | ||
| 3 | EIF1 | 5080100 | 223 | 1.814 | 0.5258 | Yes | ||
| 4 | PTK2 | 1780148 | 249 | 1.681 | 0.6671 | Yes | ||
| 5 | EIF2B3 | 3290463 | 448 | 1.256 | 0.7631 | Yes | ||
| 6 | EIF2B2 | 4290048 | 490 | 1.174 | 0.8606 | Yes | ||
| 7 | EIF2B1 | 4610082 7040242 | 1642 | 0.423 | 0.8346 | No | ||
| 8 | FLT4 | 1240292 6350707 | 4257 | 0.044 | 0.6977 | No | ||
| 9 | NOS3 | 630152 670465 | 4451 | 0.038 | 0.6905 | No | ||
| 10 | HRAS | 1980551 | 4798 | 0.029 | 0.6744 | No | ||
| 11 | EIF2S1 | 5360292 | 5509 | 0.019 | 0.6378 | No | ||
| 12 | PLCG1 | 6020369 | 5664 | 0.017 | 0.6310 | No | ||
| 13 | FLT1 | 3830167 4920438 | 6514 | 0.011 | 0.5863 | No | ||
| 14 | PIK3R1 | 4730671 | 7437 | 0.007 | 0.5374 | No | ||
| 15 | KDR | 3610286 | 9143 | 0.002 | 0.4458 | No | ||
| 16 | PXN | 3290048 6400132 | 10670 | -0.002 | 0.3639 | No | ||
| 17 | HIF1A | 5670605 | 12286 | -0.008 | 0.2778 | No | ||
| 18 | PIK3CA | 6220129 | 12684 | -0.010 | 0.2573 | No | ||
| 19 | SHC1 | 2900731 3170504 6520537 | 13907 | -0.021 | 0.1934 | No | ||
| 20 | PRKCA | 6400551 | 13942 | -0.022 | 0.1935 | No | ||
| 21 | ARNT | 1170672 5670711 | 14773 | -0.041 | 0.1523 | No | ||
| 22 | EIF2B4 | 5270082 | 15735 | -0.114 | 0.1103 | No | ||
| 23 | ELAVL1 | 4730497 | 15984 | -0.141 | 0.1089 | No | ||
| 24 | PRKCB1 | 870019 3130092 | 17100 | -0.384 | 0.0815 | No |