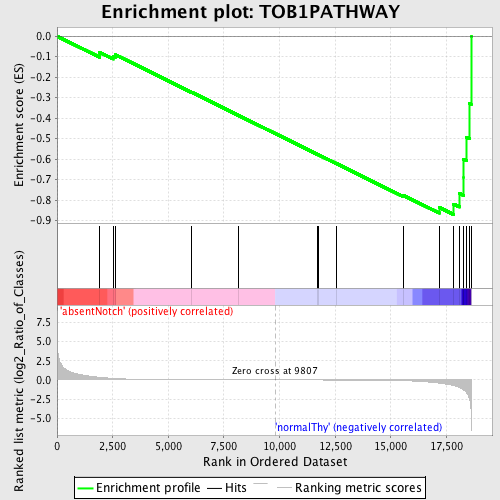
Profile of the Running ES Score & Positions of GeneSet Members on the Rank Ordered List
| Dataset | Set_03_absentNotch_versus_normalThy.phenotype_absentNotch_versus_normalThy.cls #absentNotch_versus_normalThy.phenotype_absentNotch_versus_normalThy.cls #absentNotch_versus_normalThy_repos |
| Phenotype | phenotype_absentNotch_versus_normalThy.cls#absentNotch_versus_normalThy_repos |
| Upregulated in class | normalThy |
| GeneSet | TOB1PATHWAY |
| Enrichment Score (ES) | -0.87013304 |
| Normalized Enrichment Score (NES) | -1.5500785 |
| Nominal p-value | 0.006849315 |
| FDR q-value | 0.31081322 |
| FWER p-Value | 0.991 |
| PROBE | DESCRIPTION (from dataset) | GENE SYMBOL | GENE_TITLE | RANK IN GENE LIST | RANK METRIC SCORE | RUNNING ES | CORE ENRICHMENT | |
|---|---|---|---|---|---|---|---|---|
| 1 | TGFB1 | 1940162 | 1905 | 0.345 | -0.0786 | No | ||
| 2 | TGFB3 | 1070041 | 2515 | 0.200 | -0.0975 | No | ||
| 3 | TGFBR2 | 1780711 1980537 6550398 | 2610 | 0.183 | -0.0899 | No | ||
| 4 | IL4 | 6020537 | 6051 | 0.014 | -0.2739 | No | ||
| 5 | IL2 | 1770725 | 8136 | 0.005 | -0.3856 | No | ||
| 6 | IFNG | 5670592 | 11695 | -0.006 | -0.5765 | No | ||
| 7 | TGFB2 | 4920292 | 11752 | -0.006 | -0.5791 | No | ||
| 8 | TGFBR1 | 1400148 4280020 6550711 | 12577 | -0.010 | -0.6227 | No | ||
| 9 | TGFBR3 | 5290577 | 15551 | -0.095 | -0.7760 | No | ||
| 10 | TOB1 | 4150138 | 17171 | -0.404 | -0.8351 | Yes | ||
| 11 | IL2RA | 6620450 | 17824 | -0.729 | -0.8198 | Yes | ||
| 12 | TOB2 | 1240465 | 18083 | -0.970 | -0.7666 | Yes | ||
| 13 | CD3E | 3800056 | 18269 | -1.267 | -0.6891 | Yes | ||
| 14 | CD3D | 2810739 | 18272 | -1.277 | -0.6010 | Yes | ||
| 15 | CD28 | 1400739 4210093 | 18406 | -1.672 | -0.4927 | Yes | ||
| 16 | CD3G | 2680288 | 18531 | -2.468 | -0.3289 | Yes | ||
| 17 | TRB@ | 3940292 | 18610 | -4.828 | 0.0003 | Yes |

