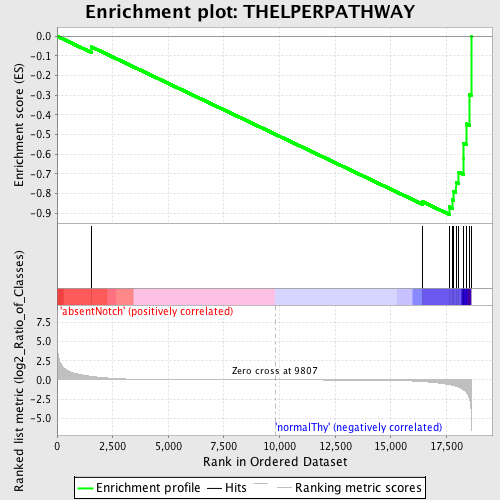
Profile of the Running ES Score & Positions of GeneSet Members on the Rank Ordered List
| Dataset | Set_03_absentNotch_versus_normalThy.phenotype_absentNotch_versus_normalThy.cls #absentNotch_versus_normalThy.phenotype_absentNotch_versus_normalThy.cls #absentNotch_versus_normalThy_repos |
| Phenotype | phenotype_absentNotch_versus_normalThy.cls#absentNotch_versus_normalThy_repos |
| Upregulated in class | normalThy |
| GeneSet | THELPERPATHWAY |
| Enrichment Score (ES) | -0.90604043 |
| Normalized Enrichment Score (NES) | -1.5014945 |
| Nominal p-value | 0.006329114 |
| FDR q-value | 0.43702695 |
| FWER p-Value | 1.0 |
| PROBE | DESCRIPTION (from dataset) | GENE SYMBOL | GENE_TITLE | RANK IN GENE LIST | RANK METRIC SCORE | RUNNING ES | CORE ENRICHMENT | |
|---|---|---|---|---|---|---|---|---|
| 1 | PTPRC | 130402 5290148 | 1547 | 0.456 | -0.0546 | No | ||
| 2 | THY1 | 5910162 | 16422 | -0.209 | -0.8410 | No | ||
| 3 | ICAM1 | 6980138 | 17634 | -0.612 | -0.8677 | Yes | ||
| 4 | CD2 | 430672 | 17771 | -0.696 | -0.8314 | Yes | ||
| 5 | ITGB2 | 6380348 | 17832 | -0.734 | -0.7887 | Yes | ||
| 6 | ITGAL | 1450324 | 17929 | -0.809 | -0.7431 | Yes | ||
| 7 | CD4 | 1090010 | 18045 | -0.930 | -0.6910 | Yes | ||
| 8 | CD3E | 3800056 | 18269 | -1.267 | -0.6236 | Yes | ||
| 9 | CD3D | 2810739 | 18272 | -1.277 | -0.5437 | Yes | ||
| 10 | CD28 | 1400739 4210093 | 18406 | -1.672 | -0.4461 | Yes | ||
| 11 | CD3G | 2680288 | 18531 | -2.468 | -0.2981 | Yes | ||
| 12 | TRB@ | 3940292 | 18610 | -4.828 | 0.0003 | Yes |

