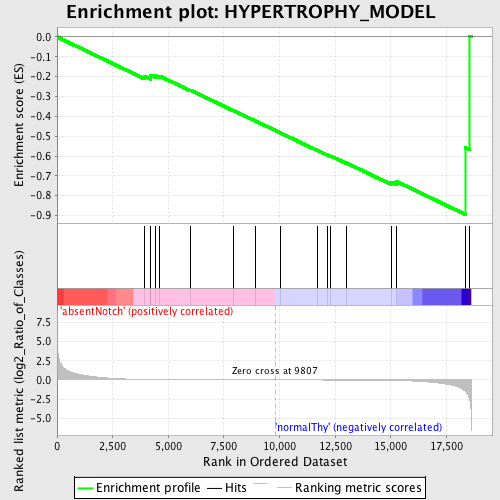
Profile of the Running ES Score & Positions of GeneSet Members on the Rank Ordered List
| Dataset | Set_03_absentNotch_versus_normalThy.phenotype_absentNotch_versus_normalThy.cls #absentNotch_versus_normalThy.phenotype_absentNotch_versus_normalThy.cls #absentNotch_versus_normalThy_repos |
| Phenotype | phenotype_absentNotch_versus_normalThy.cls#absentNotch_versus_normalThy_repos |
| Upregulated in class | normalThy |
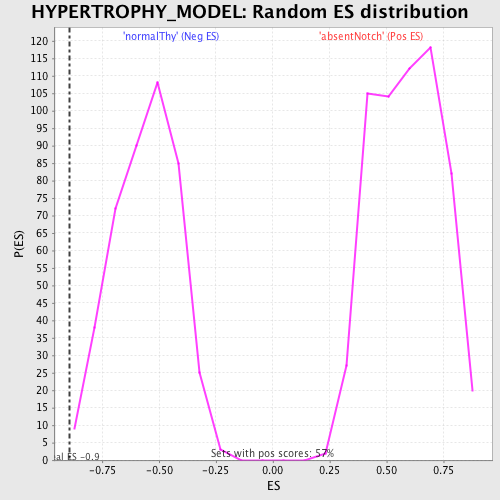
| GeneSet | HYPERTROPHY_MODEL |
| Enrichment Score (ES) | -0.8947059 |
| Normalized Enrichment Score (NES) | -1.6080492 |
| Nominal p-value | 0.004651163 |
| FDR q-value | 0.3612245 |
| FWER p-Value | 0.793 |
| PROBE | DESCRIPTION (from dataset) | GENE SYMBOL | GENE_TITLE | RANK IN GENE LIST | RANK METRIC SCORE | RUNNING ES | CORE ENRICHMENT | |
|---|---|---|---|---|---|---|---|---|
| 1 | DUSP14 | 1230358 | 3921 | 0.057 | -0.1978 | No | ||
| 2 | IL18 | 6180039 | 4198 | 0.046 | -0.2021 | No | ||
| 3 | IFRD1 | 4590215 | 4208 | 0.046 | -0.1923 | No | ||
| 4 | ATF3 | 1940546 | 4414 | 0.039 | -0.1944 | No | ||
| 5 | MYOG | 3190672 | 4612 | 0.033 | -0.1974 | No | ||
| 6 | HBEGF | 2030156 | 6002 | 0.015 | -0.2688 | No | ||
| 7 | ADAM10 | 3780156 | 7915 | 0.006 | -0.3703 | No | ||
| 8 | IL1A | 3610056 | 8910 | 0.003 | -0.4232 | No | ||
| 9 | IL1R1 | 3850377 6180128 | 10042 | -0.001 | -0.4838 | No | ||
| 10 | IFNG | 5670592 | 11695 | -0.006 | -0.5713 | No | ||
| 11 | ANKRD1 | 4850685 | 12155 | -0.008 | -0.5942 | No | ||
| 12 | GDF8 | 3850504 | 12309 | -0.009 | -0.6005 | No | ||
| 13 | NR4A3 | 2900021 5860095 5910039 | 12999 | -0.012 | -0.6347 | No | ||
| 14 | CYR61 | 1240408 5290026 4120452 6550008 | 15026 | -0.053 | -0.7315 | Yes | ||
| 15 | EIF4E | 1580403 70133 6380215 | 15251 | -0.069 | -0.7280 | Yes | ||
| 16 | WDR1 | 1090129 3990121 | 18353 | -1.479 | -0.5585 | Yes | ||
| 17 | EIF4EBP1 | 60132 5720148 | 18539 | -2.520 | 0.0041 | Yes |