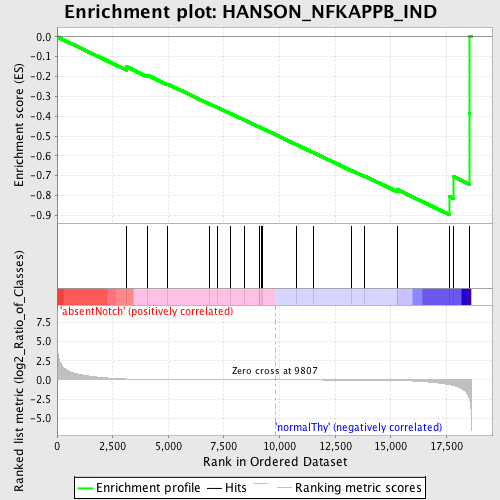
Profile of the Running ES Score & Positions of GeneSet Members on the Rank Ordered List
| Dataset | Set_03_absentNotch_versus_normalThy.phenotype_absentNotch_versus_normalThy.cls #absentNotch_versus_normalThy.phenotype_absentNotch_versus_normalThy.cls #absentNotch_versus_normalThy_repos |
| Phenotype | phenotype_absentNotch_versus_normalThy.cls#absentNotch_versus_normalThy_repos |
| Upregulated in class | normalThy |
| GeneSet | HANSON_NFKAPPB_IND |
| Enrichment Score (ES) | -0.8956224 |
| Normalized Enrichment Score (NES) | -1.6114728 |
| Nominal p-value | 0.0022522523 |
| FDR q-value | 0.6692394 |
| FWER p-Value | 0.766 |
| PROBE | DESCRIPTION (from dataset) | GENE SYMBOL | GENE_TITLE | RANK IN GENE LIST | RANK METRIC SCORE | RUNNING ES | CORE ENRICHMENT | |
|---|---|---|---|---|---|---|---|---|
| 1 | SH3RF1 | 1190463 2450594 6020026 | 3121 | 0.115 | -0.1506 | No | ||
| 2 | SERPINB2 | 70487 | 4056 | 0.051 | -0.1931 | No | ||
| 3 | CGREF1 | 4540546 | 4977 | 0.026 | -0.2386 | No | ||
| 4 | TMOD2 | 5130180 | 6845 | 0.010 | -0.3376 | No | ||
| 5 | ALDH1A3 | 2100270 | 7192 | 0.008 | -0.3550 | No | ||
| 6 | OLFR1508 | 1450463 | 7802 | 0.006 | -0.3868 | No | ||
| 7 | ADRA2C | 5130154 | 8405 | 0.004 | -0.4186 | No | ||
| 8 | OAS1H | 3360722 | 9077 | 0.002 | -0.4544 | No | ||
| 9 | NPPB | 4150722 | 9104 | 0.002 | -0.4555 | No | ||
| 10 | CRISP1 | 50181 | 9192 | 0.002 | -0.4599 | No | ||
| 11 | LGALS7 | 630148 | 9244 | 0.002 | -0.4624 | No | ||
| 12 | PKP1 | 1500433 | 10755 | -0.003 | -0.5432 | No | ||
| 13 | CLCF1 | 4920176 6550750 | 11542 | -0.005 | -0.5847 | No | ||
| 14 | SOX5 | 2370576 2900167 3190128 5050528 | 13250 | -0.014 | -0.6743 | No | ||
| 15 | TSLP | 730408 1990500 | 13834 | -0.020 | -0.7026 | No | ||
| 16 | COL18A1 | 610301 4570338 | 15287 | -0.071 | -0.7701 | No | ||
| 17 | SELPL | 1770167 | 17623 | -0.609 | -0.8042 | Yes | ||
| 18 | PIP5K1B | 3450113 6380278 | 17827 | -0.731 | -0.7055 | Yes | ||
| 19 | STK10 | 2760010 3940605 | 18523 | -2.389 | -0.3844 | Yes | ||
| 20 | KLF3 | 5130438 | 18548 | -2.594 | 0.0037 | Yes |

