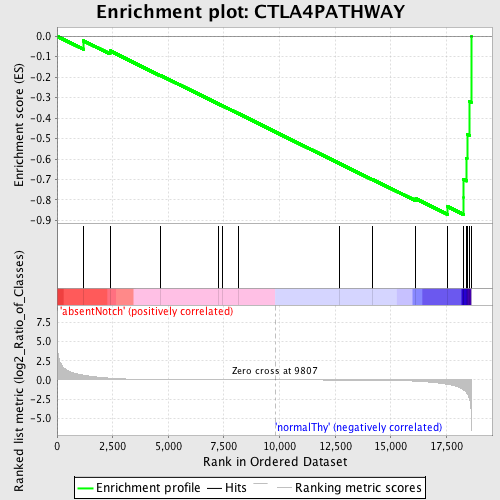
Profile of the Running ES Score & Positions of GeneSet Members on the Rank Ordered List
| Dataset | Set_03_absentNotch_versus_normalThy.phenotype_absentNotch_versus_normalThy.cls #absentNotch_versus_normalThy.phenotype_absentNotch_versus_normalThy.cls #absentNotch_versus_normalThy_repos |
| Phenotype | phenotype_absentNotch_versus_normalThy.cls#absentNotch_versus_normalThy_repos |
| Upregulated in class | normalThy |
| GeneSet | CTLA4PATHWAY |
| Enrichment Score (ES) | -0.87087435 |
| Normalized Enrichment Score (NES) | -1.5053685 |
| Nominal p-value | 0.0044444446 |
| FDR q-value | 0.4344001 |
| FWER p-Value | 1.0 |
| PROBE | DESCRIPTION (from dataset) | GENE SYMBOL | GENE_TITLE | RANK IN GENE LIST | RANK METRIC SCORE | RUNNING ES | CORE ENRICHMENT | |
|---|---|---|---|---|---|---|---|---|
| 1 | GRB2 | 6650398 | 1188 | 0.612 | -0.0228 | No | ||
| 2 | CD80 | 870112 | 2380 | 0.226 | -0.0716 | No | ||
| 3 | CD86 | 3390471 6200280 | 4662 | 0.032 | -0.1921 | No | ||
| 4 | PTPN11 | 2230100 2470180 6100528 | 7257 | 0.008 | -0.3310 | No | ||
| 5 | PIK3R1 | 4730671 | 7437 | 0.007 | -0.3402 | No | ||
| 6 | IL2 | 1770725 | 8136 | 0.005 | -0.3774 | No | ||
| 7 | PIK3CA | 6220129 | 12684 | -0.010 | -0.6211 | No | ||
| 8 | CTLA4 | 6590537 | 14189 | -0.026 | -0.7002 | No | ||
| 9 | ICOS | 1190048 | 16128 | -0.161 | -0.7936 | No | ||
| 10 | LCK | 3360142 | 17548 | -0.561 | -0.8322 | Yes | ||
| 11 | CD3E | 3800056 | 18269 | -1.267 | -0.7858 | Yes | ||
| 12 | CD3D | 2810739 | 18272 | -1.277 | -0.7002 | Yes | ||
| 13 | CD28 | 1400739 4210093 | 18406 | -1.672 | -0.5951 | Yes | ||
| 14 | ITK | 2230592 | 18426 | -1.732 | -0.4798 | Yes | ||
| 15 | CD3G | 2680288 | 18531 | -2.468 | -0.3197 | Yes | ||
| 16 | TRB@ | 3940292 | 18610 | -4.828 | 0.0003 | Yes |

