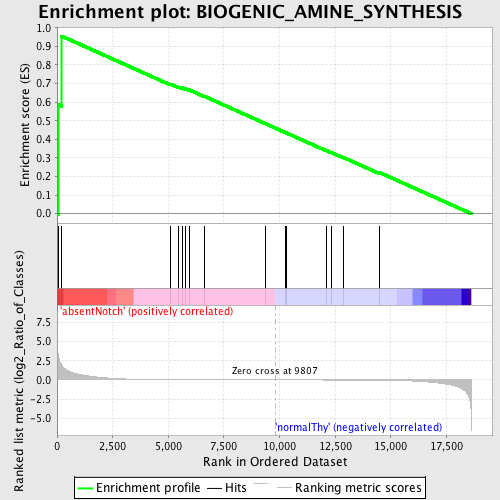
Profile of the Running ES Score & Positions of GeneSet Members on the Rank Ordered List
| Dataset | Set_03_absentNotch_versus_normalThy.phenotype_absentNotch_versus_normalThy.cls #absentNotch_versus_normalThy.phenotype_absentNotch_versus_normalThy.cls #absentNotch_versus_normalThy_repos |
| Phenotype | phenotype_absentNotch_versus_normalThy.cls#absentNotch_versus_normalThy_repos |
| Upregulated in class | absentNotch |
| GeneSet | BIOGENIC_AMINE_SYNTHESIS |
| Enrichment Score (ES) | 0.95527 |
| Normalized Enrichment Score (NES) | 1.5986474 |
| Nominal p-value | 0.0 |
| FDR q-value | 0.080478154 |
| FWER p-Value | 0.643 |
| PROBE | DESCRIPTION (from dataset) | GENE SYMBOL | GENE_TITLE | RANK IN GENE LIST | RANK METRIC SCORE | RUNNING ES | CORE ENRICHMENT | |
|---|---|---|---|---|---|---|---|---|
| 1 | DDC | 670408 | 79 | 2.938 | 0.5852 | Yes | ||
| 2 | COMT | 360687 510577 5700092 | 207 | 1.879 | 0.9553 | Yes | ||
| 3 | PNMT | 4210563 | 5095 | 0.024 | 0.6974 | No | ||
| 4 | GAD1 | 2360035 3140167 | 5465 | 0.019 | 0.6815 | No | ||
| 5 | SLC18A3 | 3060035 | 5617 | 0.018 | 0.6770 | No | ||
| 6 | TH | 2100056 | 5768 | 0.017 | 0.6722 | No | ||
| 7 | GAD2 | 1400088 | 5945 | 0.015 | 0.6658 | No | ||
| 8 | CHAT | 6840603 | 6638 | 0.011 | 0.6307 | No | ||
| 9 | MAOA | 1410039 4610324 | 9368 | 0.001 | 0.4843 | No | ||
| 10 | DBH | 3610458 | 10284 | -0.001 | 0.4354 | No | ||
| 11 | TPH1 | 780180 | 10296 | -0.001 | 0.4351 | No | ||
| 12 | ACHE | 5290750 | 12092 | -0.008 | 0.3401 | No | ||
| 13 | AANAT | 610609 | 12313 | -0.009 | 0.3300 | No | ||
| 14 | PAH | 3800309 | 12875 | -0.012 | 0.3021 | No | ||
| 15 | HDC | 4150463 | 14496 | -0.032 | 0.2215 | No |

