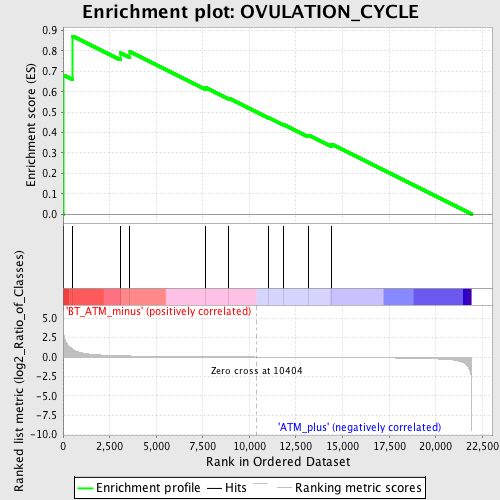
Profile of the Running ES Score & Positions of GeneSet Members on the Rank Ordered List
| Dataset | Set_02_BT_ATM_minus_versus_ATM_plus.phenotype_BT_ATM_minus_versus_ATM_plus.cls #BT_ATM_minus_versus_ATM_plus.phenotype_BT_ATM_minus_versus_ATM_plus.cls #BT_ATM_minus_versus_ATM_plus_repos |
| Phenotype | phenotype_BT_ATM_minus_versus_ATM_plus.cls#BT_ATM_minus_versus_ATM_plus_repos |
| Upregulated in class | BT_ATM_minus |
| GeneSet | OVULATION_CYCLE |
| Enrichment Score (ES) | 0.8727762 |
| Normalized Enrichment Score (NES) | 1.6338478 |
| Nominal p-value | 0.009140768 |
| FDR q-value | 0.6083976 |
| FWER p-Value | 0.997 |
| PROBE | DESCRIPTION (from dataset) | GENE SYMBOL | GENE_TITLE | RANK IN GENE LIST | RANK METRIC SCORE | RUNNING ES | CORE ENRICHMENT | |
|---|---|---|---|---|---|---|---|---|
| 1 | EIF2B5 | 1433886_at 1445908_at | 34 | 3.068 | 0.6806 | Yes | ||
| 2 | SOD1 | 1435304_at 1440222_at 1440896_at 1451124_at 1459976_s_at | 524 | 0.965 | 0.8728 | Yes | ||
| 3 | BMPR1B | 1422872_at 1437312_at 1443720_s_at | 3081 | 0.156 | 0.7909 | No | ||
| 4 | SPRR2F | 1449833_at | 3589 | 0.132 | 0.7971 | No | ||
| 5 | EIF2B2 | 1434538_x_at 1437428_x_at 1451136_a_at | 7652 | 0.038 | 0.6202 | No | ||
| 6 | SPRR2D | 1420771_at | 8880 | 0.020 | 0.5688 | No | ||
| 7 | SPRR2A | 1437258_at 1439016_x_at 1450618_a_at | 11049 | -0.009 | 0.4718 | No | ||
| 8 | EREG | 1419431_at | 11817 | -0.018 | 0.4409 | No | ||
| 9 | FOXL2 | 1444002_at | 13165 | -0.036 | 0.3876 | No | ||
| 10 | EIF2B4 | 1449940_a_at | 14401 | -0.056 | 0.3436 | No |

