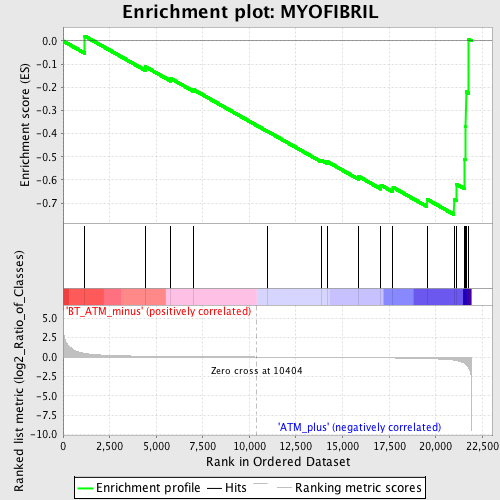
Profile of the Running ES Score & Positions of GeneSet Members on the Rank Ordered List
| Dataset | Set_02_BT_ATM_minus_versus_ATM_plus.phenotype_BT_ATM_minus_versus_ATM_plus.cls #BT_ATM_minus_versus_ATM_plus.phenotype_BT_ATM_minus_versus_ATM_plus.cls #BT_ATM_minus_versus_ATM_plus_repos |
| Phenotype | phenotype_BT_ATM_minus_versus_ATM_plus.cls#BT_ATM_minus_versus_ATM_plus_repos |
| Upregulated in class | ATM_plus |
| GeneSet | MYOFIBRIL |
| Enrichment Score (ES) | -0.7488376 |
| Normalized Enrichment Score (NES) | -1.6849204 |
| Nominal p-value | 0.016548464 |
| FDR q-value | 0.75385135 |
| FWER p-Value | 0.993 |
| PROBE | DESCRIPTION (from dataset) | GENE SYMBOL | GENE_TITLE | RANK IN GENE LIST | RANK METRIC SCORE | RUNNING ES | CORE ENRICHMENT | |
|---|---|---|---|---|---|---|---|---|
| 1 | VCL | 1416156_at 1416157_at 1445256_at | 1169 | 0.463 | 0.0209 | No | ||
| 2 | TPM2 | 1419738_a_at 1419739_at 1425028_a_at 1449577_x_at | 4434 | 0.101 | -0.1117 | No | ||
| 3 | NEB | 1435355_at | 5784 | 0.070 | -0.1620 | No | ||
| 4 | ABRA | 1458455_at | 6995 | 0.048 | -0.2095 | No | ||
| 5 | TNNC1 | 1418370_at | 10957 | -0.007 | -0.3890 | No | ||
| 6 | MYOZ2 | 1418769_at | 13874 | -0.047 | -0.5145 | No | ||
| 7 | TTN | 1427445_a_at 1427446_s_at 1431928_at 1444083_at 1444638_at 1446450_at | 14185 | -0.052 | -0.5204 | No | ||
| 8 | DES | 1426731_at | 15858 | -0.080 | -0.5838 | No | ||
| 9 | MYOM1 | 1420693_at | 17068 | -0.107 | -0.6219 | No | ||
| 10 | TNNI3 | 1422536_at | 17714 | -0.124 | -0.6314 | No | ||
| 11 | ACTA1 | 1427735_a_at | 19541 | -0.199 | -0.6828 | No | ||
| 12 | TPM1 | 1423049_a_at 1423721_at 1447713_at 1456623_at | 20990 | -0.401 | -0.6845 | Yes | ||
| 13 | TPM4 | 1433883_at | 21123 | -0.452 | -0.6181 | Yes | ||
| 14 | DMD | 1417307_at 1430320_at 1446156_at 1448665_at 1457022_at | 21554 | -0.797 | -0.5099 | Yes | ||
| 15 | TPM3 | 1427260_a_at 1427567_a_at 1436958_x_at 1449996_a_at 1449997_at | 21624 | -0.911 | -0.3670 | Yes | ||
| 16 | SVIL | 1427662_at 1460694_s_at 1460735_at | 21635 | -0.928 | -0.2186 | Yes | ||
| 17 | TNNT2 | 1418726_a_at 1424967_x_at 1440424_at | 21786 | -1.448 | 0.0068 | Yes |

