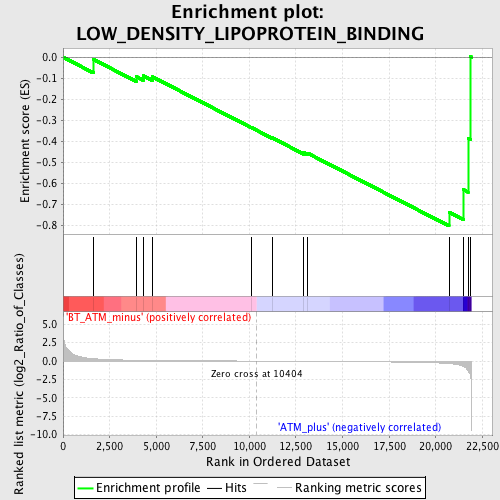
Profile of the Running ES Score & Positions of GeneSet Members on the Rank Ordered List
| Dataset | Set_02_BT_ATM_minus_versus_ATM_plus.phenotype_BT_ATM_minus_versus_ATM_plus.cls #BT_ATM_minus_versus_ATM_plus.phenotype_BT_ATM_minus_versus_ATM_plus.cls #BT_ATM_minus_versus_ATM_plus_repos |
| Phenotype | phenotype_BT_ATM_minus_versus_ATM_plus.cls#BT_ATM_minus_versus_ATM_plus_repos |
| Upregulated in class | ATM_plus |
| GeneSet | LOW_DENSITY_LIPOPROTEIN_BINDING |
| Enrichment Score (ES) | -0.80303603 |
| Normalized Enrichment Score (NES) | -1.7227738 |
| Nominal p-value | 0.016706444 |
| FDR q-value | 0.6151699 |
| FWER p-Value | 0.976 |
| PROBE | DESCRIPTION (from dataset) | GENE SYMBOL | GENE_TITLE | RANK IN GENE LIST | RANK METRIC SCORE | RUNNING ES | CORE ENRICHMENT | |
|---|---|---|---|---|---|---|---|---|
| 1 | COLEC12 | 1419693_at 1446535_at | 1621 | 0.328 | -0.0100 | No | ||
| 2 | ANKRA2 | 1430668_a_at 1441935_at | 3924 | 0.118 | -0.0919 | No | ||
| 3 | STAB2 | 1419423_at | 4298 | 0.105 | -0.0883 | No | ||
| 4 | LRP6 | 1451022_at | 4799 | 0.092 | -0.0932 | No | ||
| 5 | SCARF1 | 1434490_at | 10134 | 0.004 | -0.3358 | No | ||
| 6 | CDH13 | 1423551_at 1431824_at 1454015_a_at 1459535_at | 11228 | -0.011 | -0.3836 | No | ||
| 7 | STAB1 | 1450199_a_at | 12934 | -0.033 | -0.4548 | No | ||
| 8 | APOA4 | 1417761_at 1436504_x_at | 13149 | -0.036 | -0.4576 | No | ||
| 9 | VLDLR | 1417900_a_at 1434465_x_at 1435893_at 1438258_at 1442169_at 1451156_s_at | 20724 | -0.332 | -0.7381 | Yes | ||
| 10 | LDLR | 1421821_at 1431947_at 1450383_at 1459403_at | 21497 | -0.733 | -0.6303 | Yes | ||
| 11 | SORL1 | 1426258_at 1445889_at 1453003_at 1460390_at | 21747 | -1.311 | -0.3858 | Yes | ||
| 12 | CXCL16 | 1418718_at 1449195_s_at | 21890 | -2.020 | 0.0020 | Yes |

