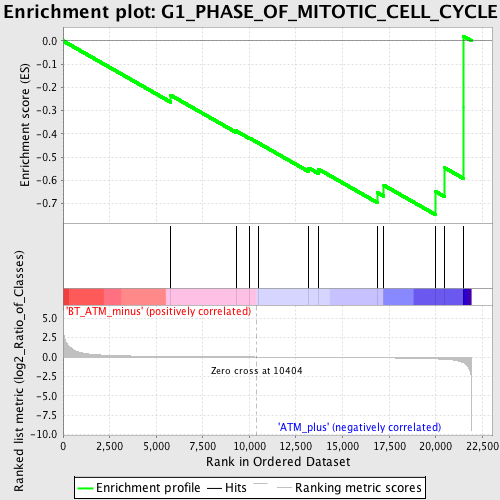
Profile of the Running ES Score & Positions of GeneSet Members on the Rank Ordered List
| Dataset | Set_02_BT_ATM_minus_versus_ATM_plus.phenotype_BT_ATM_minus_versus_ATM_plus.cls #BT_ATM_minus_versus_ATM_plus.phenotype_BT_ATM_minus_versus_ATM_plus.cls #BT_ATM_minus_versus_ATM_plus_repos |
| Phenotype | phenotype_BT_ATM_minus_versus_ATM_plus.cls#BT_ATM_minus_versus_ATM_plus_repos |
| Upregulated in class | ATM_plus |
| GeneSet | G1_PHASE_OF_MITOTIC_CELL_CYCLE |
| Enrichment Score (ES) | -0.7467392 |
| Normalized Enrichment Score (NES) | -1.5829917 |
| Nominal p-value | 0.037383176 |
| FDR q-value | 0.69910836 |
| FWER p-Value | 1.0 |
| PROBE | DESCRIPTION (from dataset) | GENE SYMBOL | GENE_TITLE | RANK IN GENE LIST | RANK METRIC SCORE | RUNNING ES | CORE ENRICHMENT | |
|---|---|---|---|---|---|---|---|---|
| 1 | E2F1 | 1417878_at 1431875_a_at 1447840_x_at | 5785 | 0.070 | -0.2339 | No | ||
| 2 | CDC25C | 1422252_a_at | 9291 | 0.015 | -0.3874 | No | ||
| 3 | CDK10 | 1433975_at | 10016 | 0.005 | -0.4182 | No | ||
| 4 | CDK6 | 1435338_at 1440040_at 1455287_at 1460291_at | 10467 | -0.001 | -0.4384 | No | ||
| 5 | MAP3K11 | 1450669_at | 13197 | -0.037 | -0.5471 | No | ||
| 6 | GFI1B | 1420399_at | 13717 | -0.044 | -0.5519 | No | ||
| 7 | CDC6 | 1417019_a_at | 16864 | -0.101 | -0.6521 | Yes | ||
| 8 | CDK2 | 1416873_a_at 1447617_at | 17227 | -0.111 | -0.6212 | Yes | ||
| 9 | CDKN1C | 1417649_at | 19980 | -0.234 | -0.6470 | Yes | ||
| 10 | TBRG4 | 1417658_at 1442793_s_at 1448795_a_at 1448796_s_at | 20467 | -0.291 | -0.5450 | Yes | ||
| 11 | TAF1 | 1447417_at 1455513_at 1458744_at | 21484 | -0.716 | -0.2855 | Yes | ||
| 12 | CDC23 | 1433430_s_at 1443087_at 1460549_a_at | 21485 | -0.716 | 0.0205 | Yes |

