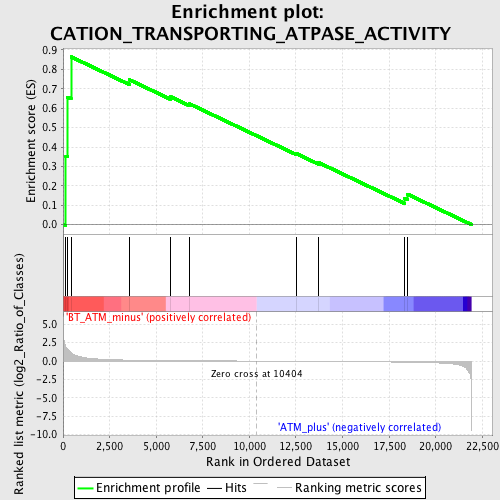
Profile of the Running ES Score & Positions of GeneSet Members on the Rank Ordered List
| Dataset | Set_02_BT_ATM_minus_versus_ATM_plus.phenotype_BT_ATM_minus_versus_ATM_plus.cls #BT_ATM_minus_versus_ATM_plus.phenotype_BT_ATM_minus_versus_ATM_plus.cls #BT_ATM_minus_versus_ATM_plus_repos |
| Phenotype | phenotype_BT_ATM_minus_versus_ATM_plus.cls#BT_ATM_minus_versus_ATM_plus_repos |
| Upregulated in class | BT_ATM_minus |
| GeneSet | CATION_TRANSPORTING_ATPASE_ACTIVITY |
| Enrichment Score (ES) | 0.86458266 |
| Normalized Enrichment Score (NES) | 1.6279683 |
| Nominal p-value | 0.012797075 |
| FDR q-value | 0.51559454 |
| FWER p-Value | 0.998 |

| PROBE | DESCRIPTION (from dataset) | GENE SYMBOL | GENE_TITLE | RANK IN GENE LIST | RANK METRIC SCORE | RUNNING ES | CORE ENRICHMENT | |
|---|---|---|---|---|---|---|---|---|
| 1 | ATP2A2 | 1416551_at 1427250_at 1427251_at 1437797_at 1443551_at 1452363_a_at 1458927_at | 147 | 1.927 | 0.3538 | Yes | ||
| 2 | ATP6V1B2 | 1415814_at 1419883_s_at 1446465_at 1449649_at | 231 | 1.641 | 0.6568 | Yes | ||
| 3 | ATP2C1 | 1431196_at 1434386_at 1437738_at 1439215_at 1442742_at | 429 | 1.159 | 0.8646 | Yes | ||
| 4 | ATP2B1 | 1428936_at 1428937_at 1452969_at 1458346_x_at | 3567 | 0.132 | 0.7463 | No | ||
| 5 | ATP2B4 | 1445701_at | 5763 | 0.071 | 0.6594 | No | ||
| 6 | ATP6V0C | 1416392_a_at 1435732_x_at 1438925_x_at | 6774 | 0.052 | 0.6230 | No | ||
| 7 | ATP2A1 | 1419312_at | 12557 | -0.028 | 0.3646 | No | ||
| 8 | ATP2B3 | 1442645_at 1445679_at | 13734 | -0.045 | 0.3193 | No | ||
| 9 | ATP2A3 | 1421129_a_at 1450124_a_at | 18330 | -0.143 | 0.1364 | No | ||
| 10 | ATP6V1C1 | 1419544_at 1419545_a_at 1419546_at | 18497 | -0.149 | 0.1568 | No |

