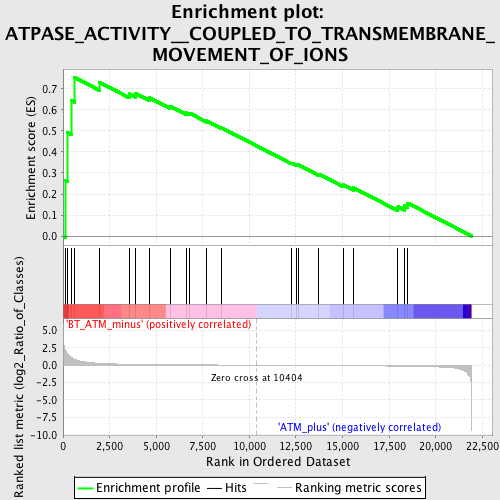
Profile of the Running ES Score & Positions of GeneSet Members on the Rank Ordered List
| Dataset | Set_02_BT_ATM_minus_versus_ATM_plus.phenotype_BT_ATM_minus_versus_ATM_plus.cls #BT_ATM_minus_versus_ATM_plus.phenotype_BT_ATM_minus_versus_ATM_plus.cls #BT_ATM_minus_versus_ATM_plus_repos |
| Phenotype | phenotype_BT_ATM_minus_versus_ATM_plus.cls#BT_ATM_minus_versus_ATM_plus_repos |
| Upregulated in class | BT_ATM_minus |
| GeneSet | ATPASE_ACTIVITY__COUPLED_TO_TRANSMEMBRANE_MOVEMENT_OF_IONS |
| Enrichment Score (ES) | 0.75381476 |
| Normalized Enrichment Score (NES) | 1.60071 |
| Nominal p-value | 0.017699115 |
| FDR q-value | 0.51471215 |
| FWER p-Value | 1.0 |

| PROBE | DESCRIPTION (from dataset) | GENE SYMBOL | GENE_TITLE | RANK IN GENE LIST | RANK METRIC SCORE | RUNNING ES | CORE ENRICHMENT | |
|---|---|---|---|---|---|---|---|---|
| 1 | ATP2A2 | 1416551_at 1427250_at 1427251_at 1437797_at 1443551_at 1452363_a_at 1458927_at | 147 | 1.927 | 0.2646 | Yes | ||
| 2 | ATP6V1B2 | 1415814_at 1419883_s_at 1446465_at 1449649_at | 231 | 1.641 | 0.4918 | Yes | ||
| 3 | ATP2C1 | 1431196_at 1434386_at 1437738_at 1439215_at 1442742_at | 429 | 1.159 | 0.6459 | Yes | ||
| 4 | ATP7A | 1418774_a_at 1436921_at | 625 | 0.830 | 0.7538 | Yes | ||
| 5 | ATP1B2 | 1422009_at 1435148_at | 1951 | 0.268 | 0.7311 | No | ||
| 6 | ATP2B1 | 1428936_at 1428937_at 1452969_at 1458346_x_at | 3567 | 0.132 | 0.6760 | No | ||
| 7 | ATP1A1 | 1423653_at 1435919_at 1435920_x_at 1451071_a_at 1458868_at | 3899 | 0.119 | 0.6777 | No | ||
| 8 | ATP4B | 1448911_at | 4626 | 0.097 | 0.6582 | No | ||
| 9 | ATP2B4 | 1445701_at | 5763 | 0.071 | 0.6163 | No | ||
| 10 | ATP1A3 | 1424856_at 1427481_a_at | 6600 | 0.055 | 0.5859 | No | ||
| 11 | ATP6V0C | 1416392_a_at 1435732_x_at 1438925_x_at | 6774 | 0.052 | 0.5853 | No | ||
| 12 | ATP4A | 1421286_a_at | 7717 | 0.037 | 0.5475 | No | ||
| 13 | ABCB11 | 1449817_at | 8525 | 0.025 | 0.5143 | No | ||
| 14 | FXYD2 | 1419378_a_at 1419379_x_at 1449883_at 1456601_x_at | 12279 | -0.024 | 0.3464 | No | ||
| 15 | ATP2A1 | 1419312_at | 12557 | -0.028 | 0.3377 | No | ||
| 16 | ATP7B | 1421563_at 1446004_at 1450283_at | 12619 | -0.029 | 0.3390 | No | ||
| 17 | ATP2B3 | 1442645_at 1445679_at | 13734 | -0.045 | 0.2945 | No | ||
| 18 | ATP1B1 | 1418453_a_at 1423890_x_at 1439036_a_at 1451152_a_at 1455949_at | 15031 | -0.066 | 0.2446 | No | ||
| 19 | ATP1A2 | 1427465_at 1434893_at 1443823_s_at 1452308_a_at 1455136_at | 15599 | -0.075 | 0.2292 | No | ||
| 20 | ATP1B3 | 1423126_at | 17981 | -0.132 | 0.1392 | No | ||
| 21 | ATP2A3 | 1421129_a_at 1450124_a_at | 18330 | -0.143 | 0.1434 | No | ||
| 22 | ATP6V1C1 | 1419544_at 1419545_a_at 1419546_at | 18497 | -0.149 | 0.1568 | No |

