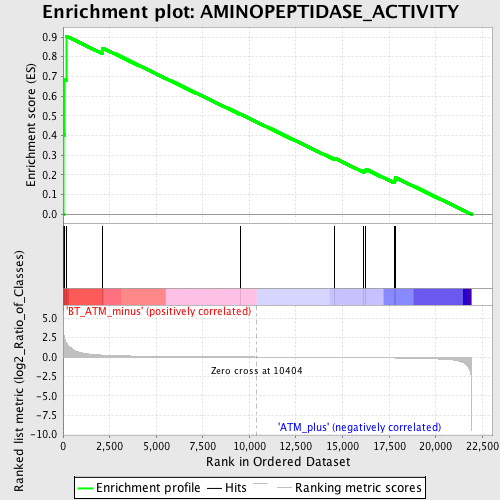
Profile of the Running ES Score & Positions of GeneSet Members on the Rank Ordered List
| Dataset | Set_02_BT_ATM_minus_versus_ATM_plus.phenotype_BT_ATM_minus_versus_ATM_plus.cls #BT_ATM_minus_versus_ATM_plus.phenotype_BT_ATM_minus_versus_ATM_plus.cls #BT_ATM_minus_versus_ATM_plus_repos |
| Phenotype | phenotype_BT_ATM_minus_versus_ATM_plus.cls#BT_ATM_minus_versus_ATM_plus_repos |
| Upregulated in class | BT_ATM_minus |
| GeneSet | AMINOPEPTIDASE_ACTIVITY |
| Enrichment Score (ES) | 0.90459037 |
| Normalized Enrichment Score (NES) | 1.6931103 |
| Nominal p-value | 0.0 |
| FDR q-value | 0.44307157 |
| FWER p-Value | 0.94 |
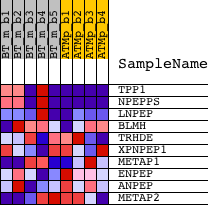
| PROBE | DESCRIPTION (from dataset) | GENE SYMBOL | GENE_TITLE | RANK IN GENE LIST | RANK METRIC SCORE | RUNNING ES | CORE ENRICHMENT | |
|---|---|---|---|---|---|---|---|---|
| 1 | TPP1 | 1434768_at 1448313_at | 27 | 3.405 | 0.4039 | Yes | ||
| 2 | NPEPPS | 1417385_at 1417386_at 1445463_at | 93 | 2.371 | 0.6831 | Yes | ||
| 3 | LNPEP | 1433747_at 1438432_at 1439326_at 1443907_at 1456347_at | 162 | 1.888 | 0.9046 | Yes | ||
| 4 | BLMH | 1438961_s_at 1439325_at 1452101_at | 2133 | 0.244 | 0.8437 | No | ||
| 5 | TRHDE | 1457156_at | 9537 | 0.012 | 0.5074 | No | ||
| 6 | XPNPEP1 | 1422443_at | 14584 | -0.058 | 0.2842 | No | ||
| 7 | METAP1 | 1426835_at 1426836_s_at 1426837_at | 16131 | -0.085 | 0.2238 | No | ||
| 8 | ENPEP | 1448649_at | 16264 | -0.088 | 0.2282 | No | ||
| 9 | ANPEP | 1421424_a_at | 17785 | -0.126 | 0.1739 | No | ||
| 10 | METAP2 | 1423610_at 1434120_a_at 1436531_at 1447263_at 1451048_at 1457416_at | 17857 | -0.128 | 0.1860 | No |