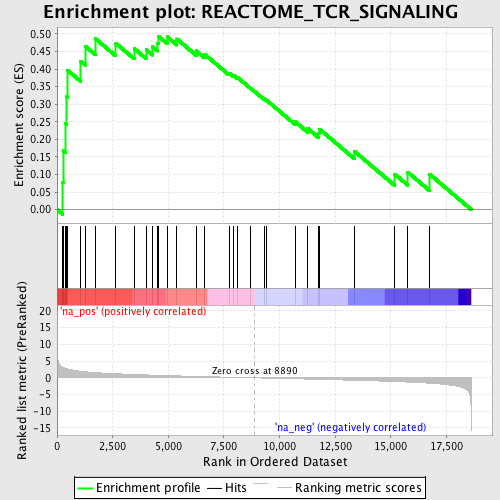
Profile of the Running ES Score & Positions of GeneSet Members on the Rank Ordered List
| Dataset | set04_DMproB_versus_LMproB |
| Phenotype | NoPhenotypeAvailable |
| Upregulated in class | na_pos |
| GeneSet | REACTOME_TCR_SIGNALING |
| Enrichment Score (ES) | 0.49382526 |
| Normalized Enrichment Score (NES) | 1.711952 |
| Nominal p-value | 0.013986014 |
| FDR q-value | 0.3091835 |
| FWER p-Value | 0.946 |
| PROBE | GENE SYMBOL | GENE_TITLE | RANK IN GENE LIST | RANK METRIC SCORE | RUNNING ES | CORE ENRICHMENT | |
|---|---|---|---|---|---|---|---|
| 1 | LCP2 | 257 | 3.134 | 0.0783 | Yes | ||
| 2 | PAK1 | 273 | 3.072 | 0.1679 | Yes | ||
| 3 | RIPK2 | 386 | 2.807 | 0.2444 | Yes | ||
| 4 | WAS | 438 | 2.700 | 0.3211 | Yes | ||
| 5 | LAT | 480 | 2.625 | 0.3961 | Yes | ||
| 6 | BCL10 | 1064 | 1.959 | 0.4223 | Yes | ||
| 7 | PIK3CB | 1268 | 1.823 | 0.4650 | Yes | ||
| 8 | CSK | 1719 | 1.565 | 0.4868 | Yes | ||
| 9 | FYB | 2640 | 1.227 | 0.4734 | Yes | ||
| 10 | IKBKB | 3468 | 0.998 | 0.4583 | Yes | ||
| 11 | CHUK | 4007 | 0.874 | 0.4550 | Yes | ||
| 12 | CD3D | 4290 | 0.801 | 0.4634 | Yes | ||
| 13 | UBE2N | 4513 | 0.753 | 0.4736 | Yes | ||
| 14 | NFKB1 | 4547 | 0.748 | 0.4938 | Yes | ||
| 15 | MAP3K7 | 4950 | 0.669 | 0.4919 | No | ||
| 16 | NFKBIA | 5386 | 0.585 | 0.4857 | No | ||
| 17 | GRAP2 | 6252 | 0.428 | 0.4517 | No | ||
| 18 | PIK3R1 | 6623 | 0.366 | 0.4426 | No | ||
| 19 | CD3E | 7728 | 0.184 | 0.3886 | No | ||
| 20 | ITK | 7914 | 0.154 | 0.3832 | No | ||
| 21 | PTPRC | 8101 | 0.122 | 0.3767 | No | ||
| 22 | PTEN | 8691 | 0.035 | 0.3461 | No | ||
| 23 | LCK | 9300 | -0.061 | 0.3151 | No | ||
| 24 | PLCG1 | 9400 | -0.078 | 0.3121 | No | ||
| 25 | CD3G | 10693 | -0.275 | 0.2507 | No | ||
| 26 | PRKCQ | 11256 | -0.370 | 0.2313 | No | ||
| 27 | ENAH | 11757 | -0.449 | 0.2176 | No | ||
| 28 | RELA | 11802 | -0.455 | 0.2286 | No | ||
| 29 | NCK1 | 13372 | -0.725 | 0.1655 | No | ||
| 30 | ZAP70 | 15176 | -1.103 | 0.1010 | No | ||
| 31 | PDPK1 | 15766 | -1.257 | 0.1063 | No | ||
| 32 | CD4 | 16740 | -1.600 | 0.1009 | No |
