Profile of the Running ES Score & Positions of GeneSet Members on the Rank Ordered List
| Dataset | set03_wtNotch_versus_truncNotch |
| Phenotype | NoPhenotypeAvailable |
| Upregulated in class | na_pos |
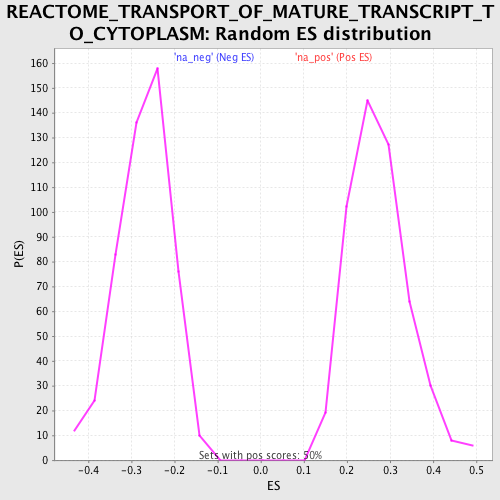
| GeneSet | REACTOME_TRANSPORT_OF_MATURE_TRANSCRIPT_TO_CYTOPLASM |
| Enrichment Score (ES) | 0.5680795 |
| Normalized Enrichment Score (NES) | 2.0805771 |
| Nominal p-value | 0.0 |
| FDR q-value | 0.0058226646 |
| FWER p-Value | 0.074 |
| PROBE | GENE SYMBOL | GENE_TITLE | RANK IN GENE LIST | RANK METRIC SCORE | RUNNING ES | CORE ENRICHMENT | |
|---|---|---|---|---|---|---|---|
| 1 | SFRS6 | 266 | 3.206 | 0.0453 | Yes | ||
| 2 | SFRS1 | 283 | 3.183 | 0.1035 | Yes | ||
| 3 | NUP107 | 499 | 2.875 | 0.1454 | Yes | ||
| 4 | EIF4E | 531 | 2.842 | 0.1965 | Yes | ||
| 5 | TPR | 702 | 2.694 | 0.2375 | Yes | ||
| 6 | SFRS3 | 745 | 2.665 | 0.2847 | Yes | ||
| 7 | NUP54 | 865 | 2.571 | 0.3261 | Yes | ||
| 8 | SFRS2 | 1068 | 2.439 | 0.3605 | Yes | ||
| 9 | NUP93 | 1191 | 2.364 | 0.3979 | Yes | ||
| 10 | RANBP2 | 1568 | 2.144 | 0.4175 | Yes | ||
| 11 | NUP160 | 1660 | 2.095 | 0.4515 | Yes | ||
| 12 | NUP37 | 1819 | 2.018 | 0.4805 | Yes | ||
| 13 | CPSF1 | 2268 | 1.786 | 0.4896 | Yes | ||
| 14 | NUP155 | 2345 | 1.744 | 0.5179 | Yes | ||
| 15 | SFRS5 | 2739 | 1.569 | 0.5259 | Yes | ||
| 16 | NCBP2 | 2776 | 1.552 | 0.5528 | Yes | ||
| 17 | SLBP | 3249 | 1.349 | 0.5525 | Yes | ||
| 18 | SFRS7 | 3406 | 1.289 | 0.5681 | Yes | ||
| 19 | NUP153 | 4317 | 0.964 | 0.5370 | No | ||
| 20 | NUP43 | 4494 | 0.908 | 0.5444 | No | ||
| 21 | NUPL2 | 4783 | 0.818 | 0.5441 | No | ||
| 22 | THOC4 | 5548 | 0.594 | 0.5141 | No | ||
| 23 | MAGOH | 5631 | 0.571 | 0.5203 | No | ||
| 24 | RAE1 | 6555 | 0.339 | 0.4769 | No | ||
| 25 | SFRS9 | 7264 | 0.172 | 0.4420 | No | ||
| 26 | NUP35 | 9530 | -0.325 | 0.3262 | No | ||
| 27 | NFX1 | 9900 | -0.396 | 0.3137 | No | ||
| 28 | U2AF1 | 10586 | -0.525 | 0.2866 | No | ||
| 29 | RNPS1 | 12946 | -0.953 | 0.1774 | No | ||
| 30 | SRRM1 | 15747 | -1.556 | 0.0556 | No | ||
| 31 | NUP62 | 15969 | -1.622 | 0.0738 | No | ||
| 32 | NUP188 | 16375 | -1.736 | 0.0843 | No | ||
| 33 | U2AF2 | 16932 | -1.950 | 0.0906 | No |