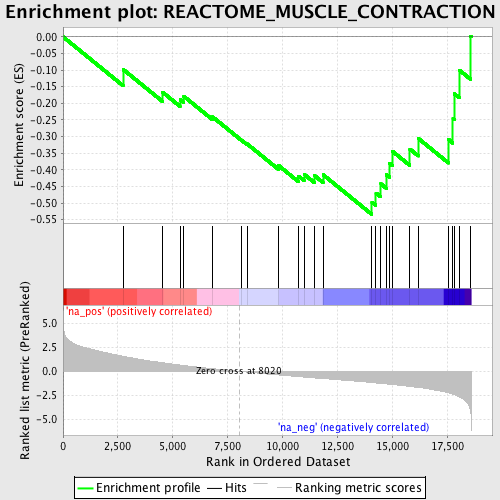
Profile of the Running ES Score & Positions of GeneSet Members on the Rank Ordered List
| Dataset | set03_wtNotch_versus_truncNotch |
| Phenotype | NoPhenotypeAvailable |
| Upregulated in class | na_neg |
| GeneSet | REACTOME_MUSCLE_CONTRACTION |
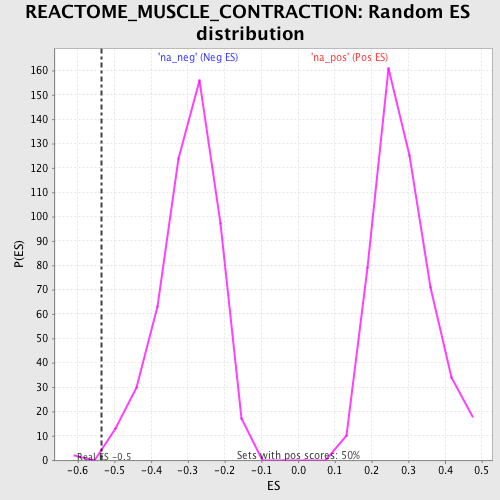
| Enrichment Score (ES) | -0.53444105 |
| Normalized Enrichment Score (NES) | -1.7824291 |
| Nominal p-value | 0.003984064 |
| FDR q-value | 0.16002004 |
| FWER p-Value | 0.801 |
| PROBE | GENE SYMBOL | GENE_TITLE | RANK IN GENE LIST | RANK METRIC SCORE | RUNNING ES | CORE ENRICHMENT | |
|---|---|---|---|---|---|---|---|
| 1 | SORBS3 | 2736 | 1.569 | -0.0980 | No | ||
| 2 | TNNT2 | 4529 | 0.896 | -0.1663 | No | ||
| 3 | NEB | 5331 | 0.655 | -0.1888 | No | ||
| 4 | VCL | 5501 | 0.607 | -0.1789 | No | ||
| 5 | MYL3 | 6813 | 0.276 | -0.2407 | No | ||
| 6 | MYH11 | 8138 | -0.024 | -0.3112 | No | ||
| 7 | MYBPC2 | 8389 | -0.080 | -0.3221 | No | ||
| 8 | TNNC1 | 9808 | -0.381 | -0.3864 | No | ||
| 9 | LMOD1 | 10736 | -0.553 | -0.4190 | No | ||
| 10 | DES | 10986 | -0.600 | -0.4136 | No | ||
| 11 | ACTG2 | 11456 | -0.687 | -0.4173 | No | ||
| 12 | TMOD1 | 11851 | -0.752 | -0.4149 | No | ||
| 13 | MYLK | 14075 | -1.166 | -0.4979 | Yes | ||
| 14 | VIM | 14259 | -1.209 | -0.4698 | Yes | ||
| 15 | MYH6 | 14483 | -1.260 | -0.4423 | Yes | ||
| 16 | DMD | 14733 | -1.309 | -0.4147 | Yes | ||
| 17 | TPM1 | 14873 | -1.341 | -0.3801 | Yes | ||
| 18 | CALM1 | 15014 | -1.376 | -0.3445 | Yes | ||
| 19 | ITGB5 | 15805 | -1.574 | -0.3377 | Yes | ||
| 20 | CALD1 | 16193 | -1.681 | -0.3058 | Yes | ||
| 21 | ACTN2 | 17567 | -2.256 | -0.3089 | Yes | ||
| 22 | TNNI3 | 17769 | -2.394 | -0.2447 | Yes | ||
| 23 | MYL6 | 17836 | -2.450 | -0.1714 | Yes | ||
| 24 | PXN | 18056 | -2.654 | -0.1000 | Yes | ||
| 25 | TCAP | 18575 | -4.151 | 0.0022 | Yes |