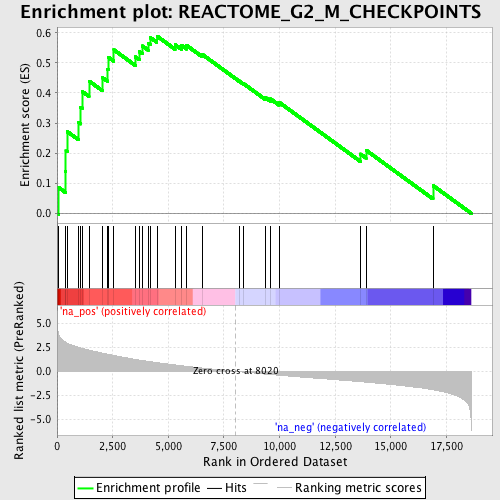
Profile of the Running ES Score & Positions of GeneSet Members on the Rank Ordered List
| Dataset | set03_wtNotch_versus_truncNotch |
| Phenotype | NoPhenotypeAvailable |
| Upregulated in class | na_pos |
| GeneSet | REACTOME_G2_M_CHECKPOINTS |
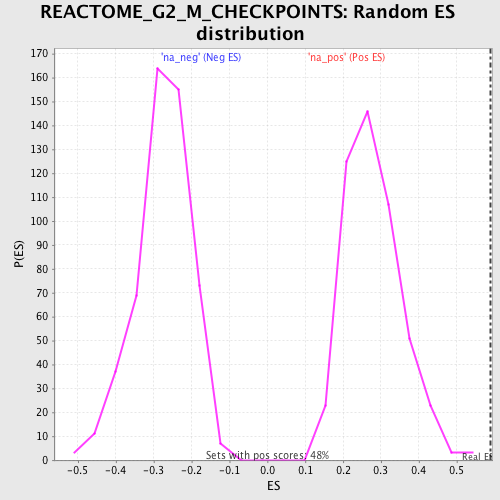
| Enrichment Score (ES) | 0.5888421 |
| Normalized Enrichment Score (NES) | 2.1021607 |
| Nominal p-value | 0.0 |
| FDR q-value | 0.00406453 |
| FWER p-Value | 0.05 |
| PROBE | GENE SYMBOL | GENE_TITLE | RANK IN GENE LIST | RANK METRIC SCORE | RUNNING ES | CORE ENRICHMENT | |
|---|---|---|---|---|---|---|---|
| 1 | ORC4L | 68 | 3.893 | 0.0860 | Yes | ||
| 2 | MCM4 | 378 | 3.033 | 0.1392 | Yes | ||
| 3 | HUS1 | 398 | 3.005 | 0.2074 | Yes | ||
| 4 | CDC7 | 454 | 2.928 | 0.2719 | Yes | ||
| 5 | RAD9B | 970 | 2.503 | 0.3018 | Yes | ||
| 6 | CCNB1 | 1062 | 2.442 | 0.3531 | Yes | ||
| 7 | CDK2 | 1128 | 2.401 | 0.4049 | Yes | ||
| 8 | RPA1 | 1435 | 2.221 | 0.4396 | Yes | ||
| 9 | CDC45L | 2034 | 1.897 | 0.4511 | Yes | ||
| 10 | ORC5L | 2275 | 1.784 | 0.4793 | Yes | ||
| 11 | CDC25C | 2318 | 1.762 | 0.5176 | Yes | ||
| 12 | RPA3 | 2554 | 1.655 | 0.5430 | Yes | ||
| 13 | MCM6 | 3518 | 1.246 | 0.5199 | Yes | ||
| 14 | RFC4 | 3704 | 1.173 | 0.5370 | Yes | ||
| 15 | WEE1 | 3832 | 1.131 | 0.5562 | Yes | ||
| 16 | ORC1L | 4093 | 1.032 | 0.5660 | Yes | ||
| 17 | CCNB2 | 4198 | 1.002 | 0.5835 | Yes | ||
| 18 | ATM | 4489 | 0.911 | 0.5888 | Yes | ||
| 19 | ORC2L | 5301 | 0.665 | 0.5605 | No | ||
| 20 | CDC25A | 5598 | 0.579 | 0.5579 | No | ||
| 21 | CHEK1 | 5824 | 0.517 | 0.5577 | No | ||
| 22 | MCM10 | 6525 | 0.345 | 0.5280 | No | ||
| 23 | RFC3 | 8179 | -0.034 | 0.4399 | No | ||
| 24 | MCM3 | 8379 | -0.078 | 0.4310 | No | ||
| 25 | MCM2 | 9380 | -0.291 | 0.3839 | No | ||
| 26 | MCM5 | 9592 | -0.339 | 0.3803 | No | ||
| 27 | RAD1 | 9975 | -0.409 | 0.3692 | No | ||
| 28 | RFC5 | 13635 | -1.084 | 0.1973 | No | ||
| 29 | MCM7 | 13889 | -1.130 | 0.2097 | No | ||
| 30 | RPA2 | 16897 | -1.935 | 0.0925 | No |