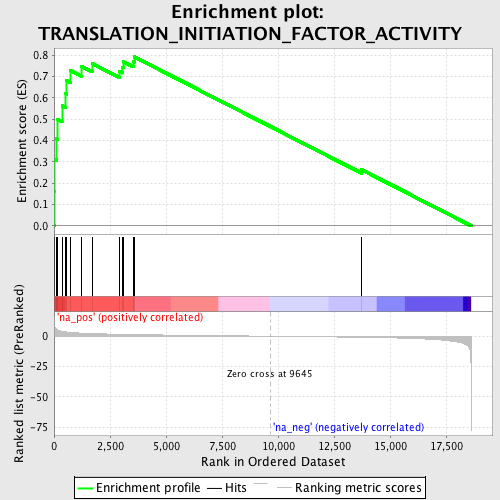
Profile of the Running ES Score & Positions of GeneSet Members on the Rank Ordered List
| Dataset | set03_wtNotch_versus_normalThy |
| Phenotype | NoPhenotypeAvailable |
| Upregulated in class | na_pos |
| GeneSet | TRANSLATION_INITIATION_FACTOR_ACTIVITY |
| Enrichment Score (ES) | 0.7920355 |
| Normalized Enrichment Score (NES) | 2.1786692 |
| Nominal p-value | 0.0 |
| FDR q-value | 0.001779279 |
| FWER p-Value | 0.0080 |

| PROBE | GENE SYMBOL | GENE_TITLE | RANK IN GENE LIST | RANK METRIC SCORE | RUNNING ES | CORE ENRICHMENT | |
|---|---|---|---|---|---|---|---|
| 1 | EIF5A | 17 | 8.994 | 0.1620 | Yes | ||
| 2 | EIF2B5 | 23 | 8.347 | 0.3129 | Yes | ||
| 3 | EIF2B3 | 116 | 5.490 | 0.4074 | Yes | ||
| 4 | COPS5 | 143 | 5.178 | 0.4998 | Yes | ||
| 5 | EIF2S2 | 356 | 4.088 | 0.5624 | Yes | ||
| 6 | EIF2S1 | 521 | 3.595 | 0.6187 | Yes | ||
| 7 | EIF4E | 566 | 3.497 | 0.6797 | Yes | ||
| 8 | EIF2B1 | 728 | 3.118 | 0.7275 | Yes | ||
| 9 | EIF4B | 1208 | 2.549 | 0.7479 | Yes | ||
| 10 | EIF4A2 | 1698 | 2.160 | 0.7608 | Yes | ||
| 11 | EIF2B4 | 2921 | 1.568 | 0.7235 | Yes | ||
| 12 | EIF2C1 | 3056 | 1.521 | 0.7438 | Yes | ||
| 13 | EIF4G2 | 3090 | 1.507 | 0.7694 | Yes | ||
| 14 | EIF2B2 | 3550 | 1.349 | 0.7691 | Yes | ||
| 15 | EIF4G1 | 3577 | 1.342 | 0.7920 | Yes | ||
| 16 | EIF4H | 13731 | -0.906 | 0.2626 | No |
