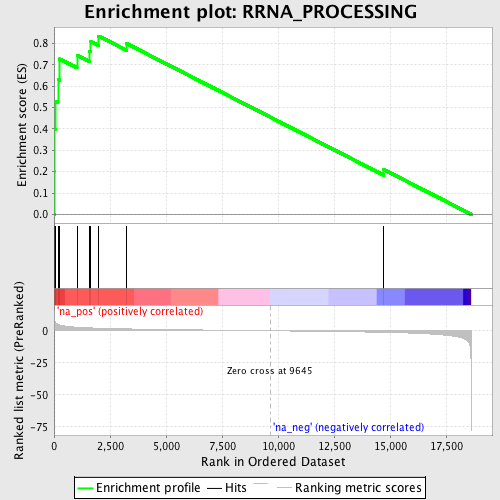
Profile of the Running ES Score & Positions of GeneSet Members on the Rank Ordered List
| Dataset | set03_wtNotch_versus_normalThy |
| Phenotype | NoPhenotypeAvailable |
| Upregulated in class | na_pos |
| GeneSet | RRNA_PROCESSING |
| Enrichment Score (ES) | 0.8349874 |
| Normalized Enrichment Score (NES) | 2.0090218 |
| Nominal p-value | 0.0 |
| FDR q-value | 0.0059644873 |
| FWER p-Value | 0.084 |
| PROBE | GENE SYMBOL | GENE_TITLE | RANK IN GENE LIST | RANK METRIC SCORE | RUNNING ES | CORE ENRICHMENT | |
|---|---|---|---|---|---|---|---|
| 1 | FBL | 12 | 9.172 | 0.2008 | Yes | ||
| 2 | NOLA2 | 16 | 9.006 | 0.3984 | Yes | ||
| 3 | NOLC1 | 74 | 6.118 | 0.5297 | Yes | ||
| 4 | RRP9 | 174 | 4.897 | 0.6319 | Yes | ||
| 5 | EXOSC2 | 240 | 4.536 | 0.7280 | Yes | ||
| 6 | POP4 | 1023 | 2.725 | 0.7458 | Yes | ||
| 7 | EXOSC7 | 1579 | 2.234 | 0.7650 | Yes | ||
| 8 | GEMIN4 | 1641 | 2.198 | 0.8100 | Yes | ||
| 9 | NOL5A | 1991 | 1.991 | 0.8350 | Yes | ||
| 10 | EXOSC3 | 3235 | 1.457 | 0.8002 | No | ||
| 11 | RPS14 | 14720 | -1.203 | 0.2094 | No |