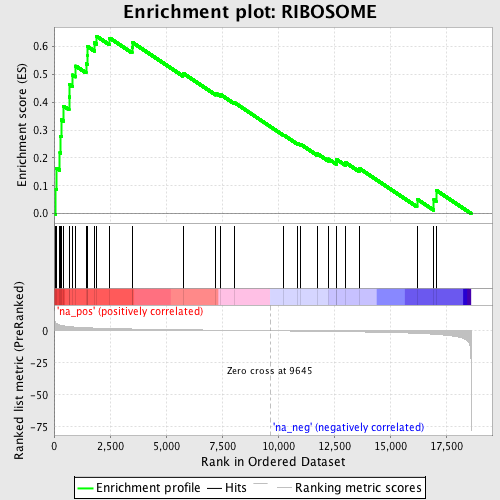
Profile of the Running ES Score & Positions of GeneSet Members on the Rank Ordered List
| Dataset | set03_wtNotch_versus_normalThy |
| Phenotype | NoPhenotypeAvailable |
| Upregulated in class | na_pos |
| GeneSet | RIBOSOME |
| Enrichment Score (ES) | 0.63716406 |
| Normalized Enrichment Score (NES) | 2.1282017 |
| Nominal p-value | 0.0 |
| FDR q-value | 0.0020463897 |
| FWER p-Value | 0.011 |
| PROBE | GENE SYMBOL | GENE_TITLE | RANK IN GENE LIST | RANK METRIC SCORE | RUNNING ES | CORE ENRICHMENT | |
|---|---|---|---|---|---|---|---|
| 1 | MRPS10 | 59 | 6.411 | 0.0878 | Yes | ||
| 2 | APEX1 | 113 | 5.508 | 0.1631 | Yes | ||
| 3 | MRPS15 | 259 | 4.452 | 0.2184 | Yes | ||
| 4 | MRPS28 | 288 | 4.334 | 0.2784 | Yes | ||
| 5 | MRPL55 | 322 | 4.235 | 0.3368 | Yes | ||
| 6 | MRPL12 | 419 | 3.849 | 0.3862 | Yes | ||
| 7 | MRPS18A | 668 | 3.244 | 0.4189 | Yes | ||
| 8 | MRPS11 | 695 | 3.185 | 0.4627 | Yes | ||
| 9 | RPL3L | 827 | 2.965 | 0.4977 | Yes | ||
| 10 | MRPS35 | 964 | 2.787 | 0.5299 | Yes | ||
| 11 | MRPS18C | 1428 | 2.337 | 0.5382 | Yes | ||
| 12 | RPS4X | 1487 | 2.295 | 0.5676 | Yes | ||
| 13 | RPL7A | 1496 | 2.289 | 0.5996 | Yes | ||
| 14 | RRBP1 | 1803 | 2.096 | 0.6129 | Yes | ||
| 15 | MRPS24 | 1892 | 2.043 | 0.6372 | Yes | ||
| 16 | MRPS12 | 2483 | 1.749 | 0.6302 | No | ||
| 17 | MRPL10 | 3481 | 1.370 | 0.5960 | No | ||
| 18 | MRPL51 | 3496 | 1.366 | 0.6147 | No | ||
| 19 | SRP68 | 5753 | 0.783 | 0.5044 | No | ||
| 20 | MRPS16 | 7217 | 0.483 | 0.4325 | No | ||
| 21 | MRPS22 | 7418 | 0.441 | 0.4280 | No | ||
| 22 | MRPL52 | 8032 | 0.319 | 0.3995 | No | ||
| 23 | RPS7 | 10247 | -0.120 | 0.2821 | No | ||
| 24 | RPL27 | 10863 | -0.248 | 0.2525 | No | ||
| 25 | NR0B1 | 10993 | -0.277 | 0.2495 | No | ||
| 26 | MRPL40 | 11741 | -0.439 | 0.2155 | No | ||
| 27 | RPL13A | 12245 | -0.543 | 0.1962 | No | ||
| 28 | MRPL23 | 12605 | -0.630 | 0.1858 | No | ||
| 29 | MRPS36 | 12613 | -0.631 | 0.1944 | No | ||
| 30 | RPS11 | 13008 | -0.720 | 0.1834 | No | ||
| 31 | FMR1 | 13617 | -0.878 | 0.1631 | No | ||
| 32 | FAU | 16200 | -1.983 | 0.0523 | No | ||
| 33 | RPL15 | 16953 | -2.675 | 0.0498 | No | ||
| 34 | MRPS21 | 17055 | -2.793 | 0.0840 | No |
