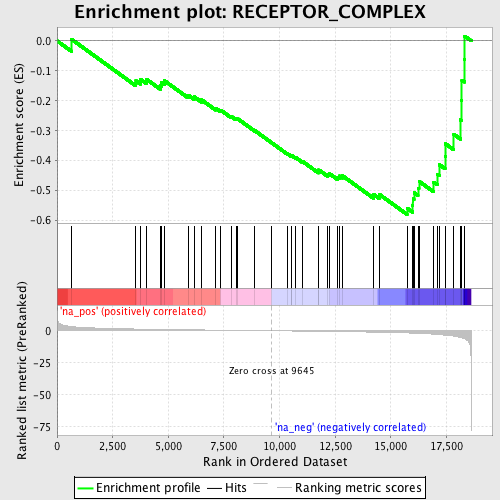
Profile of the Running ES Score & Positions of GeneSet Members on the Rank Ordered List
| Dataset | set03_wtNotch_versus_normalThy |
| Phenotype | NoPhenotypeAvailable |
| Upregulated in class | na_neg |
| GeneSet | RECEPTOR_COMPLEX |
| Enrichment Score (ES) | -0.5797683 |
| Normalized Enrichment Score (NES) | -1.804811 |
| Nominal p-value | 0.004491018 |
| FDR q-value | 0.294843 |
| FWER p-Value | 0.952 |
| PROBE | GENE SYMBOL | GENE_TITLE | RANK IN GENE LIST | RANK METRIC SCORE | RUNNING ES | CORE ENRICHMENT | |
|---|---|---|---|---|---|---|---|
| 1 | ITGA9 | 658 | 3.265 | 0.0050 | No | ||
| 2 | CHRNE | 3542 | 1.351 | -0.1335 | No | ||
| 3 | CHRNA1 | 3744 | 1.292 | -0.1284 | No | ||
| 4 | CHRNA4 | 4028 | 1.207 | -0.1286 | No | ||
| 5 | ITGB6 | 4655 | 1.049 | -0.1494 | No | ||
| 6 | GRIN1 | 4697 | 1.038 | -0.1387 | No | ||
| 7 | CHRNB3 | 4822 | 1.010 | -0.1329 | No | ||
| 8 | CHRNB2 | 5887 | 0.757 | -0.1808 | No | ||
| 9 | ITGAM | 6157 | 0.700 | -0.1866 | No | ||
| 10 | ITGA3 | 6494 | 0.629 | -0.1969 | No | ||
| 11 | CHRNB4 | 7128 | 0.506 | -0.2248 | No | ||
| 12 | CHRND | 7348 | 0.455 | -0.2309 | No | ||
| 13 | CHRNA2 | 7831 | 0.360 | -0.2524 | No | ||
| 14 | CHRNA7 | 8048 | 0.317 | -0.2601 | No | ||
| 15 | ITGB7 | 8124 | 0.298 | -0.2605 | No | ||
| 16 | ACVR1C | 8891 | 0.147 | -0.2999 | No | ||
| 17 | ACVR1 | 9653 | -0.003 | -0.3408 | No | ||
| 18 | IL13RA1 | 10349 | -0.137 | -0.3766 | No | ||
| 19 | CHRNA6 | 10526 | -0.172 | -0.3839 | No | ||
| 20 | CD79A | 10539 | -0.174 | -0.3824 | No | ||
| 21 | ITGA11 | 10731 | -0.221 | -0.3900 | No | ||
| 22 | ADRB3 | 11035 | -0.285 | -0.4028 | No | ||
| 23 | IL6R | 11750 | -0.441 | -0.4357 | No | ||
| 24 | OSMR | 11766 | -0.444 | -0.4311 | No | ||
| 25 | CHRNA3 | 12164 | -0.525 | -0.4459 | No | ||
| 26 | ITGAX | 12228 | -0.539 | -0.4426 | No | ||
| 27 | TRIP6 | 12622 | -0.633 | -0.4560 | No | ||
| 28 | ZAP70 | 12681 | -0.648 | -0.4511 | No | ||
| 29 | SRP9 | 12815 | -0.678 | -0.4498 | No | ||
| 30 | ITGA8 | 14234 | -1.053 | -0.5132 | No | ||
| 31 | TGFBR1 | 14475 | -1.126 | -0.5121 | No | ||
| 32 | ITGA10 | 15732 | -1.681 | -0.5590 | Yes | ||
| 33 | BMPR1B | 15980 | -1.831 | -0.5496 | Yes | ||
| 34 | SRPR | 15996 | -1.841 | -0.5276 | Yes | ||
| 35 | SYK | 16044 | -1.873 | -0.5069 | Yes | ||
| 36 | ITGB3 | 16223 | -2.000 | -0.4917 | Yes | ||
| 37 | SDCBP | 16267 | -2.033 | -0.4689 | Yes | ||
| 38 | ADRB2 | 16930 | -2.649 | -0.4717 | Yes | ||
| 39 | IL28RA | 17086 | -2.838 | -0.4449 | Yes | ||
| 40 | SMAD3 | 17176 | -2.959 | -0.4131 | Yes | ||
| 41 | ITGA5 | 17440 | -3.396 | -0.3852 | Yes | ||
| 42 | BCL10 | 17457 | -3.421 | -0.3437 | Yes | ||
| 43 | ITGAE | 17831 | -4.185 | -0.3119 | Yes | ||
| 44 | ITGB4 | 18137 | -5.231 | -0.2636 | Yes | ||
| 45 | MYH9 | 18164 | -5.388 | -0.1983 | Yes | ||
| 46 | CARD11 | 18195 | -5.524 | -0.1315 | Yes | ||
| 47 | TGFBR2 | 18307 | -6.182 | -0.0609 | Yes | ||
| 48 | CD247 | 18319 | -6.255 | 0.0160 | Yes |
