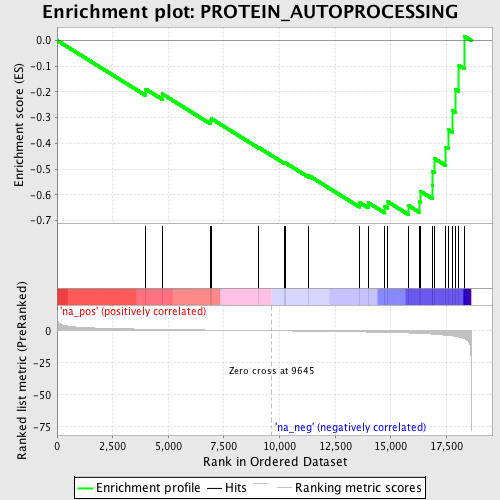
Profile of the Running ES Score & Positions of GeneSet Members on the Rank Ordered List
| Dataset | set03_wtNotch_versus_normalThy |
| Phenotype | NoPhenotypeAvailable |
| Upregulated in class | na_neg |
| GeneSet | PROTEIN_AUTOPROCESSING |
| Enrichment Score (ES) | -0.6765166 |
| Normalized Enrichment Score (NES) | -1.8161007 |
| Nominal p-value | 0.0032948928 |
| FDR q-value | 0.33364105 |
| FWER p-Value | 0.937 |
| PROBE | GENE SYMBOL | GENE_TITLE | RANK IN GENE LIST | RANK METRIC SCORE | RUNNING ES | CORE ENRICHMENT | |
|---|---|---|---|---|---|---|---|
| 1 | TTN | 3978 | 1.220 | -0.1889 | No | ||
| 2 | TNK1 | 4725 | 1.030 | -0.2079 | No | ||
| 3 | AKT1 | 6886 | 0.551 | -0.3127 | No | ||
| 4 | MAP3K9 | 6919 | 0.544 | -0.3033 | No | ||
| 5 | MAP3K10 | 9073 | 0.112 | -0.4168 | No | ||
| 6 | MAP3K13 | 10237 | -0.118 | -0.4769 | No | ||
| 7 | CDKL5 | 10264 | -0.122 | -0.4758 | No | ||
| 8 | MYO3A | 11311 | -0.342 | -0.5250 | No | ||
| 9 | PAK2 | 13592 | -0.871 | -0.6298 | No | ||
| 10 | EIF2AK1 | 13989 | -0.984 | -0.6309 | No | ||
| 11 | PCSK9 | 14732 | -1.209 | -0.6460 | Yes | ||
| 12 | PAK1 | 14871 | -1.265 | -0.6274 | Yes | ||
| 13 | UHMK1 | 15785 | -1.710 | -0.6414 | Yes | ||
| 14 | INSR | 16269 | -2.034 | -0.6256 | Yes | ||
| 15 | CAMKK2 | 16332 | -2.086 | -0.5861 | Yes | ||
| 16 | LMTK2 | 16862 | -2.568 | -0.5619 | Yes | ||
| 17 | STK4 | 16872 | -2.580 | -0.5094 | Yes | ||
| 18 | MAP3K11 | 16964 | -2.684 | -0.4592 | Yes | ||
| 19 | IGF1R | 17477 | -3.463 | -0.4156 | Yes | ||
| 20 | EIF2AK3 | 17575 | -3.644 | -0.3460 | Yes | ||
| 21 | MAP3K12 | 17778 | -4.065 | -0.2734 | Yes | ||
| 22 | CRKRS | 17916 | -4.456 | -0.1893 | Yes | ||
| 23 | MAP3K3 | 18061 | -4.882 | -0.0968 | Yes | ||
| 24 | DYRK1A | 18303 | -6.167 | 0.0168 | Yes |
