Profile of the Running ES Score & Positions of GeneSet Members on the Rank Ordered List
| Dataset | set03_wtNotch_versus_normalThy |
| Phenotype | NoPhenotypeAvailable |
| Upregulated in class | na_pos |
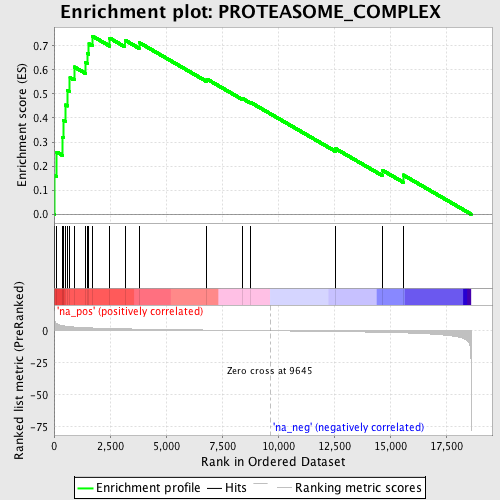
| GeneSet | PROTEASOME_COMPLEX |
| Enrichment Score (ES) | 0.7401418 |
| Normalized Enrichment Score (NES) | 2.1798065 |
| Nominal p-value | 0.0 |
| FDR q-value | 0.0019418789 |
| FWER p-Value | 0.0070 |
| PROBE | GENE SYMBOL | GENE_TITLE | RANK IN GENE LIST | RANK METRIC SCORE | RUNNING ES | CORE ENRICHMENT | |
|---|---|---|---|---|---|---|---|
| 1 | PSMD13 | 22 | 8.505 | 0.1599 | Yes | ||
| 2 | PSMC5 | 120 | 5.464 | 0.2581 | Yes | ||
| 3 | PSMD14 | 372 | 4.009 | 0.3205 | Yes | ||
| 4 | PSMD12 | 420 | 3.849 | 0.3909 | Yes | ||
| 5 | PSMD3 | 517 | 3.605 | 0.4540 | Yes | ||
| 6 | PSMD8 | 600 | 3.404 | 0.5141 | Yes | ||
| 7 | PSMC3 | 708 | 3.161 | 0.5682 | Yes | ||
| 8 | PSME3 | 901 | 2.859 | 0.6120 | Yes | ||
| 9 | PSMC6 | 1396 | 2.364 | 0.6302 | Yes | ||
| 10 | PSME2 | 1494 | 2.290 | 0.6684 | Yes | ||
| 11 | ADRM1 | 1556 | 2.251 | 0.7077 | Yes | ||
| 12 | PSMC2 | 1712 | 2.153 | 0.7401 | Yes | ||
| 13 | PSMD11 | 2485 | 1.748 | 0.7317 | No | ||
| 14 | PSMD7 | 3164 | 1.479 | 0.7233 | No | ||
| 15 | PSME1 | 3795 | 1.278 | 0.7136 | No | ||
| 16 | PSMD2 | 6824 | 0.564 | 0.5615 | No | ||
| 17 | PSMD10 | 8423 | 0.242 | 0.4801 | No | ||
| 18 | PSMD5 | 8760 | 0.172 | 0.4653 | No | ||
| 19 | PSMD4 | 12572 | -0.622 | 0.2721 | No | ||
| 20 | PSMC4 | 14658 | -1.186 | 0.1825 | No | ||
| 21 | SHFM1 | 15584 | -1.601 | 0.1630 | No |
