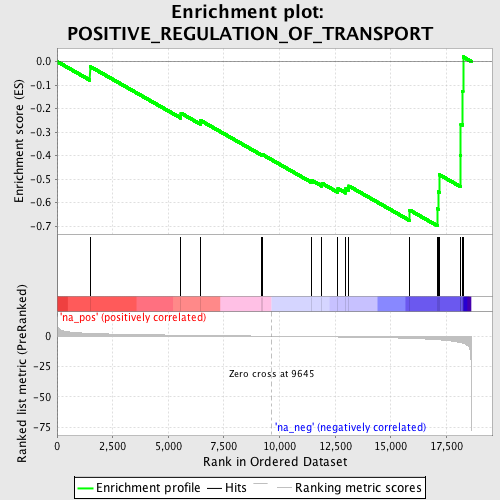
Profile of the Running ES Score & Positions of GeneSet Members on the Rank Ordered List
| Dataset | set03_wtNotch_versus_normalThy |
| Phenotype | NoPhenotypeAvailable |
| Upregulated in class | na_neg |
| GeneSet | POSITIVE_REGULATION_OF_TRANSPORT |
| Enrichment Score (ES) | -0.6995386 |
| Normalized Enrichment Score (NES) | -1.7774354 |
| Nominal p-value | 0.0016420361 |
| FDR q-value | 0.28426903 |
| FWER p-Value | 0.973 |

| PROBE | GENE SYMBOL | GENE_TITLE | RANK IN GENE LIST | RANK METRIC SCORE | RUNNING ES | CORE ENRICHMENT | |
|---|---|---|---|---|---|---|---|
| 1 | NCBP2 | 1478 | 2.300 | -0.0209 | No | ||
| 2 | AHSG | 5566 | 0.829 | -0.2196 | No | ||
| 3 | SPACA3 | 6447 | 0.637 | -0.2507 | No | ||
| 4 | GHRH | 9208 | 0.087 | -0.3968 | No | ||
| 5 | GATA2 | 9212 | 0.087 | -0.3948 | No | ||
| 6 | SFTPD | 11441 | -0.371 | -0.5051 | No | ||
| 7 | GCK | 11905 | -0.472 | -0.5180 | No | ||
| 8 | TRIP6 | 12622 | -0.633 | -0.5404 | No | ||
| 9 | CARTPT | 12978 | -0.714 | -0.5413 | No | ||
| 10 | CDH1 | 13114 | -0.749 | -0.5295 | No | ||
| 11 | GHRL | 15847 | -1.744 | -0.6320 | Yes | ||
| 12 | TNFSF14 | 17105 | -2.862 | -0.6267 | Yes | ||
| 13 | GSK3B | 17139 | -2.906 | -0.5544 | Yes | ||
| 14 | SMAD3 | 17176 | -2.959 | -0.4810 | Yes | ||
| 15 | PPT1 | 18130 | -5.183 | -0.4003 | Yes | ||
| 16 | CBL | 18150 | -5.305 | -0.2663 | Yes | ||
| 17 | STIM1 | 18228 | -5.669 | -0.1261 | Yes | ||
| 18 | FLNA | 18246 | -5.770 | 0.0199 | Yes |
