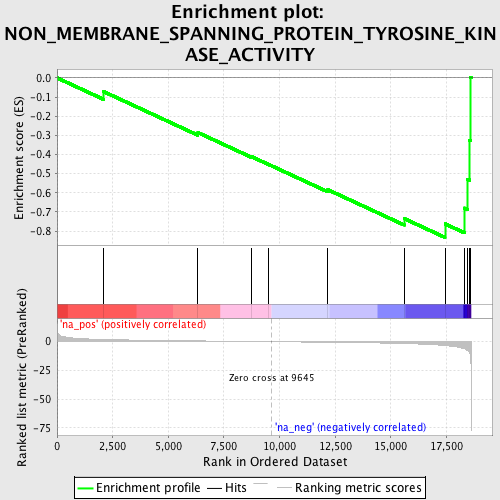
Profile of the Running ES Score & Positions of GeneSet Members on the Rank Ordered List
| Dataset | set03_wtNotch_versus_normalThy |
| Phenotype | NoPhenotypeAvailable |
| Upregulated in class | na_neg |
| GeneSet | NON_MEMBRANE_SPANNING_PROTEIN_TYROSINE_KINASE_ACTIVITY |
| Enrichment Score (ES) | -0.8331507 |
| Normalized Enrichment Score (NES) | -1.8868924 |
| Nominal p-value | 0.0035650623 |
| FDR q-value | 0.73423076 |
| FWER p-Value | 0.779 |
| PROBE | GENE SYMBOL | GENE_TITLE | RANK IN GENE LIST | RANK METRIC SCORE | RUNNING ES | CORE ENRICHMENT | |
|---|---|---|---|---|---|---|---|
| 1 | TYK2 | 2086 | 1.942 | -0.0714 | No | ||
| 2 | PTK6 | 6329 | 0.661 | -0.2855 | No | ||
| 3 | TXK | 8749 | 0.174 | -0.4118 | No | ||
| 4 | FRK | 9494 | 0.028 | -0.4512 | No | ||
| 5 | ERBB2 | 12170 | -0.526 | -0.5840 | No | ||
| 6 | CLK1 | 15599 | -1.608 | -0.7345 | No | ||
| 7 | TNK2 | 17436 | -3.383 | -0.7622 | Yes | ||
| 8 | DYRK1A | 18303 | -6.167 | -0.6793 | Yes | ||
| 9 | ITK | 18446 | -7.525 | -0.5291 | Yes | ||
| 10 | PTK2B | 18539 | -9.957 | -0.3251 | Yes | ||
| 11 | TEC | 18587 | -15.689 | 0.0016 | Yes |
