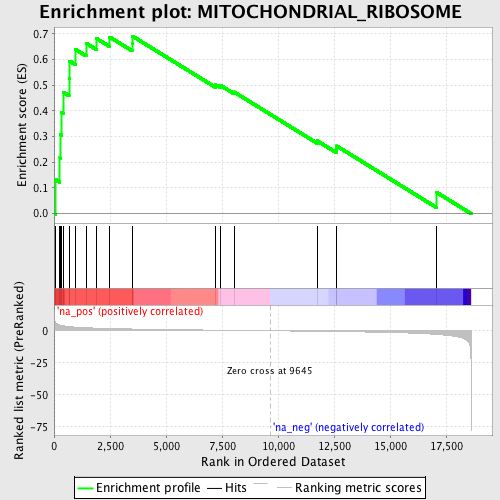
Profile of the Running ES Score & Positions of GeneSet Members on the Rank Ordered List
| Dataset | set03_wtNotch_versus_normalThy |
| Phenotype | NoPhenotypeAvailable |
| Upregulated in class | na_pos |
| GeneSet | MITOCHONDRIAL_RIBOSOME |
| Enrichment Score (ES) | 0.69086105 |
| Normalized Enrichment Score (NES) | 2.073621 |
| Nominal p-value | 0.0 |
| FDR q-value | 0.0024230615 |
| FWER p-Value | 0.028 |
| PROBE | GENE SYMBOL | GENE_TITLE | RANK IN GENE LIST | RANK METRIC SCORE | RUNNING ES | CORE ENRICHMENT | |
|---|---|---|---|---|---|---|---|
| 1 | MRPS10 | 59 | 6.411 | 0.1329 | Yes | ||
| 2 | MRPS15 | 259 | 4.452 | 0.2168 | Yes | ||
| 3 | MRPS28 | 288 | 4.334 | 0.3073 | Yes | ||
| 4 | MRPL55 | 322 | 4.235 | 0.3954 | Yes | ||
| 5 | MRPL12 | 419 | 3.849 | 0.4720 | Yes | ||
| 6 | MRPS18A | 668 | 3.244 | 0.5275 | Yes | ||
| 7 | MRPS11 | 695 | 3.185 | 0.5938 | Yes | ||
| 8 | MRPS35 | 964 | 2.787 | 0.6385 | Yes | ||
| 9 | MRPS18C | 1428 | 2.337 | 0.6632 | Yes | ||
| 10 | MRPS24 | 1892 | 2.043 | 0.6817 | Yes | ||
| 11 | MRPS12 | 2483 | 1.749 | 0.6871 | Yes | ||
| 12 | MRPL10 | 3481 | 1.370 | 0.6626 | Yes | ||
| 13 | MRPL51 | 3496 | 1.366 | 0.6909 | Yes | ||
| 14 | MRPS16 | 7217 | 0.483 | 0.5011 | No | ||
| 15 | MRPS22 | 7418 | 0.441 | 0.4997 | No | ||
| 16 | MRPL52 | 8032 | 0.319 | 0.4735 | No | ||
| 17 | MRPL40 | 11741 | -0.439 | 0.2834 | No | ||
| 18 | MRPL23 | 12605 | -0.630 | 0.2504 | No | ||
| 19 | MRPS36 | 12613 | -0.631 | 0.2634 | No | ||
| 20 | MRPS21 | 17055 | -2.793 | 0.0839 | No |
