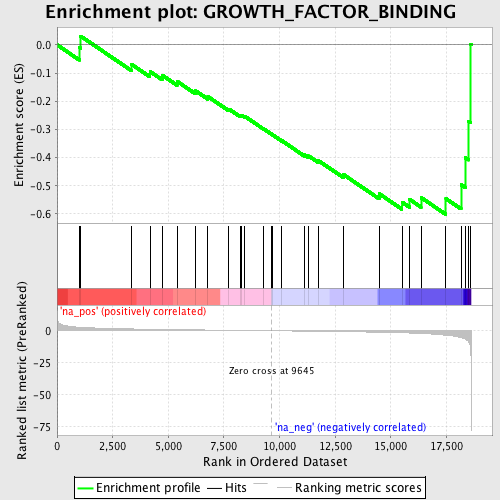
Profile of the Running ES Score & Positions of GeneSet Members on the Rank Ordered List
| Dataset | set03_wtNotch_versus_normalThy |
| Phenotype | NoPhenotypeAvailable |
| Upregulated in class | na_neg |
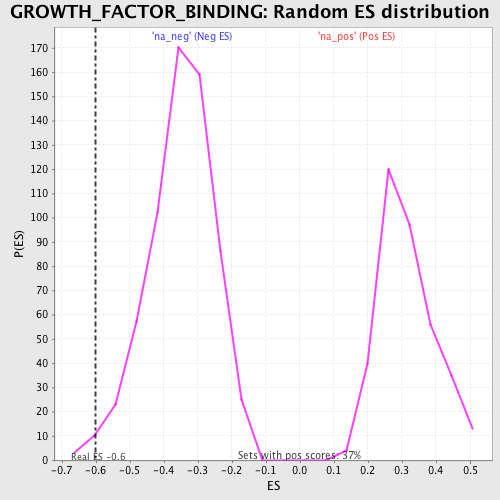
| GeneSet | GROWTH_FACTOR_BINDING |
| Enrichment Score (ES) | -0.6020505 |
| Normalized Enrichment Score (NES) | -1.7208111 |
| Nominal p-value | 0.012598425 |
| FDR q-value | 0.33161795 |
| FWER p-Value | 0.997 |
| PROBE | GENE SYMBOL | GENE_TITLE | RANK IN GENE LIST | RANK METRIC SCORE | RUNNING ES | CORE ENRICHMENT | |
|---|---|---|---|---|---|---|---|
| 1 | IL7R | 1002 | 2.746 | -0.0094 | No | ||
| 2 | IL9R | 1059 | 2.690 | 0.0311 | No | ||
| 3 | API5 | 3351 | 1.412 | -0.0693 | No | ||
| 4 | NTRK2 | 4175 | 1.166 | -0.0947 | No | ||
| 5 | HAX1 | 4723 | 1.032 | -0.1074 | No | ||
| 6 | NTRK3 | 5391 | 0.866 | -0.1293 | No | ||
| 7 | IL1R1 | 6230 | 0.683 | -0.1633 | No | ||
| 8 | IL10RB | 6778 | 0.574 | -0.1834 | No | ||
| 9 | IL2RA | 7719 | 0.384 | -0.2278 | No | ||
| 10 | A2M | 8244 | 0.273 | -0.2515 | No | ||
| 11 | CTGF | 8285 | 0.264 | -0.2494 | No | ||
| 12 | ACVR1B | 8440 | 0.237 | -0.2539 | No | ||
| 13 | NRD1 | 9291 | 0.072 | -0.2984 | No | ||
| 14 | ACVR1 | 9653 | -0.003 | -0.3178 | No | ||
| 15 | NTRK1 | 9683 | -0.009 | -0.3192 | No | ||
| 16 | ACVRL1 | 10103 | -0.091 | -0.3403 | No | ||
| 17 | IGFBP1 | 11123 | -0.303 | -0.3902 | No | ||
| 18 | IGFALS | 11302 | -0.340 | -0.3942 | No | ||
| 19 | IL6R | 11750 | -0.441 | -0.4112 | No | ||
| 20 | IL5RA | 12864 | -0.689 | -0.4599 | No | ||
| 21 | TGFBR1 | 14475 | -1.126 | -0.5282 | No | ||
| 22 | IL3RA | 15502 | -1.557 | -0.5582 | Yes | ||
| 23 | IL2RB | 15844 | -1.743 | -0.5484 | Yes | ||
| 24 | ACVR2B | 16359 | -2.103 | -0.5420 | Yes | ||
| 25 | IGF1R | 17477 | -3.463 | -0.5460 | Yes | ||
| 26 | IL2RG | 18158 | -5.351 | -0.4959 | Yes | ||
| 27 | IL6ST | 18347 | -6.519 | -0.4005 | Yes | ||
| 28 | IL10RA | 18501 | -8.458 | -0.2717 | Yes | ||
| 29 | IL4R | 18594 | -17.159 | 0.0012 | Yes |