Profile of the Running ES Score & Positions of GeneSet Members on the Rank Ordered List
| Dataset | set03_wtNotch_versus_normalThy |
| Phenotype | NoPhenotypeAvailable |
| Upregulated in class | na_neg |
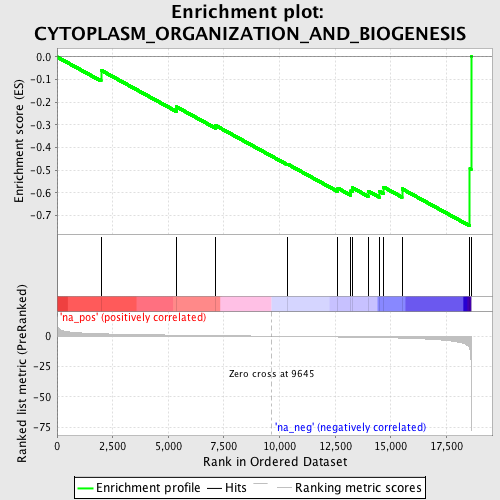
| GeneSet | CYTOPLASM_ORGANIZATION_AND_BIOGENESIS |
| Enrichment Score (ES) | -0.7464358 |
| Normalized Enrichment Score (NES) | -1.7598889 |
| Nominal p-value | 0.008517887 |
| FDR q-value | 0.30486944 |
| FWER p-Value | 0.984 |
| PROBE | GENE SYMBOL | GENE_TITLE | RANK IN GENE LIST | RANK METRIC SCORE | RUNNING ES | CORE ENRICHMENT | |
|---|---|---|---|---|---|---|---|
| 1 | VCL | 1975 | 2.000 | -0.0588 | No | ||
| 2 | GJA5 | 5368 | 0.872 | -0.2204 | No | ||
| 3 | GJC1 | 7129 | 0.506 | -0.3031 | No | ||
| 4 | PARD6A | 10366 | -0.141 | -0.4737 | No | ||
| 5 | GJA4 | 12619 | -0.632 | -0.5797 | No | ||
| 6 | CD9 | 13187 | -0.772 | -0.5919 | No | ||
| 7 | PRKCI | 13267 | -0.791 | -0.5774 | No | ||
| 8 | TJP1 | 13981 | -0.982 | -0.5925 | Yes | ||
| 9 | TLN1 | 14477 | -1.127 | -0.5924 | Yes | ||
| 10 | GJA1 | 14671 | -1.189 | -0.5746 | Yes | ||
| 11 | PARD6B | 15504 | -1.558 | -0.5824 | Yes | ||
| 12 | LAMC1 | 18557 | -10.686 | -0.4933 | Yes | ||
| 13 | ITGA6 | 18608 | -20.949 | 0.0004 | Yes |
