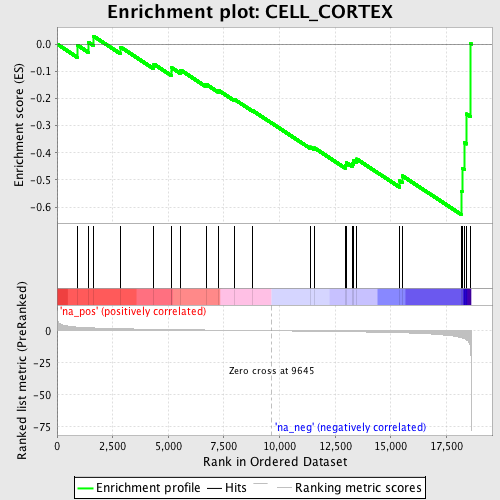
Profile of the Running ES Score & Positions of GeneSet Members on the Rank Ordered List
| Dataset | set03_wtNotch_versus_normalThy |
| Phenotype | NoPhenotypeAvailable |
| Upregulated in class | na_neg |
| GeneSet | CELL_CORTEX |
| Enrichment Score (ES) | -0.6269756 |
| Normalized Enrichment Score (NES) | -1.7535868 |
| Nominal p-value | 0.0032840723 |
| FDR q-value | 0.30159962 |
| FWER p-Value | 0.992 |
| PROBE | GENE SYMBOL | GENE_TITLE | RANK IN GENE LIST | RANK METRIC SCORE | RUNNING ES | CORE ENRICHMENT | |
|---|---|---|---|---|---|---|---|
| 1 | NCL | 903 | 2.857 | -0.0034 | No | ||
| 2 | CNKSR1 | 1404 | 2.357 | 0.0069 | No | ||
| 3 | ANLN | 1635 | 2.205 | 0.0294 | No | ||
| 4 | MYH10 | 2852 | 1.592 | -0.0108 | No | ||
| 5 | LASP1 | 4348 | 1.125 | -0.0735 | No | ||
| 6 | DBNL | 5147 | 0.933 | -0.1017 | No | ||
| 7 | TSC1 | 5148 | 0.932 | -0.0869 | No | ||
| 8 | CTTN | 5551 | 0.833 | -0.0954 | No | ||
| 9 | ARFIP2 | 6703 | 0.589 | -0.1480 | No | ||
| 10 | TRPC4 | 7269 | 0.471 | -0.1709 | No | ||
| 11 | GYPC | 7953 | 0.335 | -0.2024 | No | ||
| 12 | SPINK5 | 8798 | 0.164 | -0.2452 | No | ||
| 13 | GYS2 | 11383 | -0.356 | -0.3786 | No | ||
| 14 | SLC4A1 | 11565 | -0.397 | -0.3820 | No | ||
| 15 | MAPRE1 | 12962 | -0.712 | -0.4459 | No | ||
| 16 | GIPC1 | 12993 | -0.717 | -0.4362 | No | ||
| 17 | PRKCI | 13267 | -0.791 | -0.4383 | No | ||
| 18 | CLASP1 | 13332 | -0.808 | -0.4290 | No | ||
| 19 | MYO6 | 13462 | -0.839 | -0.4227 | No | ||
| 20 | ARF6 | 15400 | -1.497 | -0.5032 | No | ||
| 21 | SPTBN4 | 15523 | -1.570 | -0.4850 | No | ||
| 22 | MYH9 | 18164 | -5.388 | -0.5418 | Yes | ||
| 23 | PAFAH1B1 | 18207 | -5.572 | -0.4560 | Yes | ||
| 24 | PSCDBP | 18317 | -6.246 | -0.3632 | Yes | ||
| 25 | MYO9B | 18401 | -7.002 | -0.2570 | Yes | ||
| 26 | SCIN | 18593 | -16.990 | 0.0012 | Yes |
