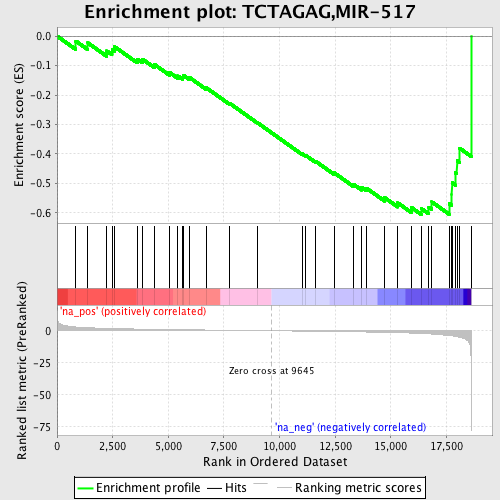
Profile of the Running ES Score & Positions of GeneSet Members on the Rank Ordered List
| Dataset | set03_wtNotch_versus_normalThy |
| Phenotype | NoPhenotypeAvailable |
| Upregulated in class | na_neg |
| GeneSet | TCTAGAG,MIR-517 |
| Enrichment Score (ES) | -0.6058294 |
| Normalized Enrichment Score (NES) | -1.7922832 |
| Nominal p-value | 0.00761035 |
| FDR q-value | 0.08821141 |
| FWER p-Value | 0.593 |
| PROBE | GENE SYMBOL | GENE_TITLE | RANK IN GENE LIST | RANK METRIC SCORE | RUNNING ES | CORE ENRICHMENT | |
|---|---|---|---|---|---|---|---|
| 1 | ING3 | 842 | 2.947 | -0.0168 | No | ||
| 2 | SLC39A10 | 1383 | 2.375 | -0.0230 | No | ||
| 3 | TNPO2 | 2229 | 1.870 | -0.0504 | No | ||
| 4 | CUL3 | 2468 | 1.756 | -0.0462 | No | ||
| 5 | GTF3C4 | 2589 | 1.700 | -0.0363 | No | ||
| 6 | DCX | 3606 | 1.334 | -0.0781 | No | ||
| 7 | CUGBP2 | 3835 | 1.266 | -0.0781 | No | ||
| 8 | KCND2 | 4374 | 1.118 | -0.0963 | No | ||
| 9 | PTPN9 | 5052 | 0.958 | -0.1234 | No | ||
| 10 | TWIST1 | 5426 | 0.858 | -0.1352 | No | ||
| 11 | CS | 5656 | 0.810 | -0.1397 | No | ||
| 12 | FEZ2 | 5672 | 0.806 | -0.1328 | No | ||
| 13 | RND3 | 5958 | 0.743 | -0.1409 | No | ||
| 14 | SCRT1 | 6705 | 0.589 | -0.1754 | No | ||
| 15 | PAPPA | 7741 | 0.380 | -0.2274 | No | ||
| 16 | FST | 8994 | 0.125 | -0.2936 | No | ||
| 17 | HOXB13 | 11018 | -0.282 | -0.3997 | No | ||
| 18 | ARIH1 | 11164 | -0.312 | -0.4045 | No | ||
| 19 | SNAP25 | 11603 | -0.405 | -0.4242 | No | ||
| 20 | PLEKHA3 | 12453 | -0.594 | -0.4641 | No | ||
| 21 | MAGED1 | 13319 | -0.804 | -0.5029 | No | ||
| 22 | GDF8 | 13691 | -0.896 | -0.5142 | No | ||
| 23 | HOXB9 | 13908 | -0.960 | -0.5166 | No | ||
| 24 | ILF3 | 14724 | -1.205 | -0.5488 | No | ||
| 25 | ISL1 | 15313 | -1.449 | -0.5665 | No | ||
| 26 | YPEL1 | 15928 | -1.791 | -0.5822 | No | ||
| 27 | CRSP7 | 16368 | -2.110 | -0.5855 | Yes | ||
| 28 | RBM3 | 16708 | -2.401 | -0.5805 | Yes | ||
| 29 | PKNOX1 | 16845 | -2.554 | -0.5632 | Yes | ||
| 30 | HOXA4 | 17622 | -3.725 | -0.5689 | Yes | ||
| 31 | AEBP2 | 17747 | -3.998 | -0.5370 | Yes | ||
| 32 | CBX8 | 17749 | -4.009 | -0.4983 | Yes | ||
| 33 | BCL2L2 | 17906 | -4.415 | -0.4641 | Yes | ||
| 34 | RNF40 | 17974 | -4.617 | -0.4231 | Yes | ||
| 35 | FBS1 | 18099 | -5.050 | -0.3810 | Yes | ||
| 36 | HMGN3 | 18615 | -42.322 | 0.0001 | Yes |
