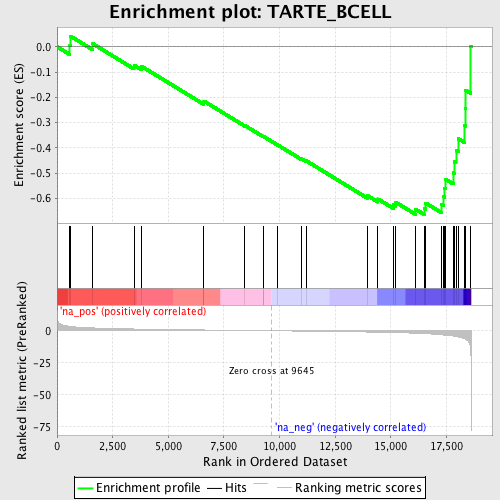
Profile of the Running ES Score & Positions of GeneSet Members on the Rank Ordered List
| Dataset | set03_wtNotch_versus_normalThy |
| Phenotype | NoPhenotypeAvailable |
| Upregulated in class | na_neg |
| GeneSet | TARTE_BCELL |
| Enrichment Score (ES) | -0.66296065 |
| Normalized Enrichment Score (NES) | -1.9311967 |
| Nominal p-value | 0.0030959751 |
| FDR q-value | 0.10369206 |
| FWER p-Value | 0.783 |

| PROBE | GENE SYMBOL | GENE_TITLE | RANK IN GENE LIST | RANK METRIC SCORE | RUNNING ES | CORE ENRICHMENT | |
|---|---|---|---|---|---|---|---|
| 1 | NFKBIE | 575 | 3.473 | 0.0065 | No | ||
| 2 | GCH1 | 598 | 3.411 | 0.0421 | No | ||
| 3 | MAPRE2 | 1608 | 2.216 | 0.0117 | No | ||
| 4 | REL | 3458 | 1.377 | -0.0729 | No | ||
| 5 | LYL1 | 3792 | 1.279 | -0.0770 | No | ||
| 6 | NFKB1 | 6591 | 0.610 | -0.2210 | No | ||
| 7 | BLR1 | 6597 | 0.609 | -0.2147 | No | ||
| 8 | BLK | 8442 | 0.237 | -0.3113 | No | ||
| 9 | AIM1 | 9275 | 0.075 | -0.3553 | No | ||
| 10 | RHOH | 9276 | 0.075 | -0.3545 | No | ||
| 11 | ELF4 | 9914 | -0.052 | -0.3882 | No | ||
| 12 | MMD | 10988 | -0.275 | -0.4430 | No | ||
| 13 | MS4A1 | 11189 | -0.317 | -0.4503 | No | ||
| 14 | AHR | 13940 | -0.971 | -0.5878 | No | ||
| 15 | IRF8 | 14422 | -1.110 | -0.6017 | No | ||
| 16 | MOBK1B | 15116 | -1.364 | -0.6243 | No | ||
| 17 | CIITA | 15221 | -1.409 | -0.6147 | No | ||
| 18 | BIN1 | 16119 | -1.925 | -0.6422 | Yes | ||
| 19 | CCND3 | 16501 | -2.216 | -0.6388 | Yes | ||
| 20 | RHOG | 16566 | -2.270 | -0.6178 | Yes | ||
| 21 | ITPR1 | 17263 | -3.094 | -0.6218 | Yes | ||
| 22 | CD37 | 17376 | -3.274 | -0.5925 | Yes | ||
| 23 | GPR18 | 17426 | -3.361 | -0.5589 | Yes | ||
| 24 | HHEX | 17461 | -3.430 | -0.5238 | Yes | ||
| 25 | SATB1 | 17806 | -4.123 | -0.4978 | Yes | ||
| 26 | IFNGR1 | 17866 | -4.284 | -0.4548 | Yes | ||
| 27 | GIT2 | 17930 | -4.482 | -0.4098 | Yes | ||
| 28 | CD83 | 18043 | -4.825 | -0.3638 | Yes | ||
| 29 | TGFBR2 | 18307 | -6.182 | -0.3113 | Yes | ||
| 30 | AXIN1 | 18349 | -6.535 | -0.2430 | Yes | ||
| 31 | LTB | 18369 | -6.691 | -0.1718 | Yes | ||
| 32 | IL4R | 18594 | -17.159 | 0.0012 | Yes |
