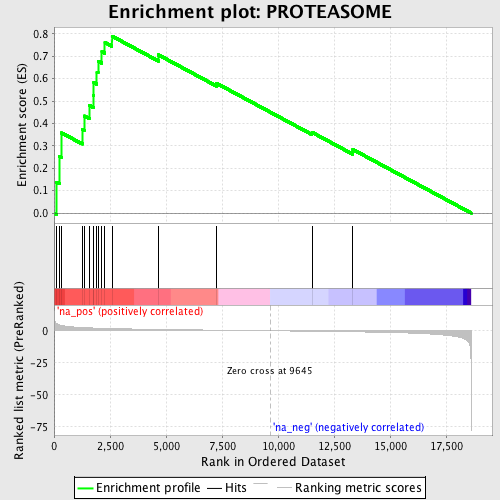
Profile of the Running ES Score & Positions of GeneSet Members on the Rank Ordered List
| Dataset | set03_wtNotch_versus_normalThy |
| Phenotype | NoPhenotypeAvailable |
| Upregulated in class | na_pos |
| GeneSet | PROTEASOME |
| Enrichment Score (ES) | 0.78990746 |
| Normalized Enrichment Score (NES) | 2.3009942 |
| Nominal p-value | 0.0 |
| FDR q-value | 0.0 |
| FWER p-Value | 0.0 |
| PROBE | GENE SYMBOL | GENE_TITLE | RANK IN GENE LIST | RANK METRIC SCORE | RUNNING ES | CORE ENRICHMENT | |
|---|---|---|---|---|---|---|---|
| 1 | PSMB1 | 117 | 5.485 | 0.1387 | Yes | ||
| 2 | PSMB2 | 231 | 4.585 | 0.2538 | Yes | ||
| 3 | PSMB10 | 340 | 4.153 | 0.3578 | Yes | ||
| 4 | PSMA4 | 1262 | 2.491 | 0.3741 | Yes | ||
| 5 | PSMB7 | 1344 | 2.409 | 0.4334 | Yes | ||
| 6 | PSMA7 | 1576 | 2.237 | 0.4801 | Yes | ||
| 7 | PSMB6 | 1762 | 2.123 | 0.5263 | Yes | ||
| 8 | PSMB9 | 1773 | 2.117 | 0.5817 | Yes | ||
| 9 | PSMA2 | 1913 | 2.034 | 0.6280 | Yes | ||
| 10 | PSMB5 | 1964 | 2.005 | 0.6783 | Yes | ||
| 11 | PSMA5 | 2135 | 1.923 | 0.7200 | Yes | ||
| 12 | PSMB3 | 2270 | 1.851 | 0.7617 | Yes | ||
| 13 | PSMB8 | 2584 | 1.704 | 0.7899 | Yes | ||
| 14 | PSMA1 | 4659 | 1.048 | 0.7061 | No | ||
| 15 | PSMA6 | 7253 | 0.475 | 0.5792 | No | ||
| 16 | PSMB4 | 11512 | -0.386 | 0.3605 | No | ||
| 17 | PSMA3 | 13335 | -0.808 | 0.2839 | No |
