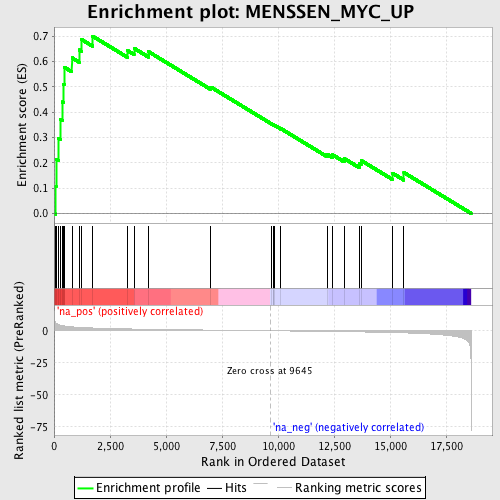
Profile of the Running ES Score & Positions of GeneSet Members on the Rank Ordered List
| Dataset | set03_wtNotch_versus_normalThy |
| Phenotype | NoPhenotypeAvailable |
| Upregulated in class | na_pos |
| GeneSet | MENSSEN_MYC_UP |
| Enrichment Score (ES) | 0.70025575 |
| Normalized Enrichment Score (NES) | 2.2027574 |
| Nominal p-value | 0.0 |
| FDR q-value | 3.090561E-4 |
| FWER p-Value | 0.0040 |
| PROBE | GENE SYMBOL | GENE_TITLE | RANK IN GENE LIST | RANK METRIC SCORE | RUNNING ES | CORE ENRICHMENT | |
|---|---|---|---|---|---|---|---|
| 1 | PFKM | 79 | 6.059 | 0.1077 | Yes | ||
| 2 | LDHA | 91 | 5.789 | 0.2141 | Yes | ||
| 3 | C1QBP | 201 | 4.728 | 0.2955 | Yes | ||
| 4 | EIF3S9 | 292 | 4.318 | 0.3705 | Yes | ||
| 5 | NME1 | 371 | 4.010 | 0.4404 | Yes | ||
| 6 | HSPD1 | 415 | 3.873 | 0.5096 | Yes | ||
| 7 | CDK4 | 450 | 3.776 | 0.5775 | Yes | ||
| 8 | CCT3 | 798 | 3.017 | 0.6146 | Yes | ||
| 9 | METAP2 | 1120 | 2.623 | 0.6458 | Yes | ||
| 10 | RPL3 | 1229 | 2.528 | 0.6867 | Yes | ||
| 11 | EPRS | 1716 | 2.151 | 0.7003 | Yes | ||
| 12 | ENO1 | 3265 | 1.445 | 0.6437 | No | ||
| 13 | HSPE1 | 3571 | 1.343 | 0.6521 | No | ||
| 14 | PIAS1 | 4218 | 1.153 | 0.6386 | No | ||
| 15 | HNRPD | 6999 | 0.530 | 0.4989 | No | ||
| 16 | EIF5 | 9700 | -0.012 | 0.3539 | No | ||
| 17 | BRCA1 | 9801 | -0.028 | 0.3490 | No | ||
| 18 | PPIF | 9807 | -0.029 | 0.3493 | No | ||
| 19 | YWHAE | 9858 | -0.041 | 0.3473 | No | ||
| 20 | CCNB1 | 10125 | -0.097 | 0.3348 | No | ||
| 21 | PHB | 12202 | -0.533 | 0.2330 | No | ||
| 22 | MSH2 | 12431 | -0.587 | 0.2316 | No | ||
| 23 | RPL32 | 12949 | -0.709 | 0.2169 | No | ||
| 24 | HSPA8 | 13628 | -0.880 | 0.1966 | No | ||
| 25 | NPM1 | 13708 | -0.901 | 0.2090 | No | ||
| 26 | PCAF | 15094 | -1.354 | 0.1595 | No | ||
| 27 | MNT | 15615 | -1.616 | 0.1614 | No |
