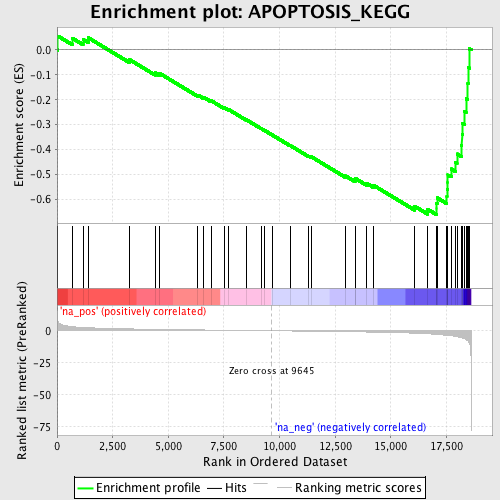
Profile of the Running ES Score & Positions of GeneSet Members on the Rank Ordered List
| Dataset | set03_wtNotch_versus_normalThy |
| Phenotype | NoPhenotypeAvailable |
| Upregulated in class | na_neg |
| GeneSet | APOPTOSIS_KEGG |
| Enrichment Score (ES) | -0.66034144 |
| Normalized Enrichment Score (NES) | -2.0171182 |
| Nominal p-value | 0.0 |
| FDR q-value | 0.11394271 |
| FWER p-Value | 0.504 |
| PROBE | GENE SYMBOL | GENE_TITLE | RANK IN GENE LIST | RANK METRIC SCORE | RUNNING ES | CORE ENRICHMENT | |
|---|---|---|---|---|---|---|---|
| 1 | BAX | 38 | 6.993 | 0.0552 | No | ||
| 2 | RIPK1 | 687 | 3.202 | 0.0465 | No | ||
| 3 | SFRS2IP | 1168 | 2.583 | 0.0418 | No | ||
| 4 | CYCS | 1401 | 2.360 | 0.0486 | No | ||
| 5 | NR3C1 | 3247 | 1.453 | -0.0388 | No | ||
| 6 | BAD | 4407 | 1.108 | -0.0921 | No | ||
| 7 | TNF | 4598 | 1.062 | -0.0937 | No | ||
| 8 | NGFB | 6324 | 0.663 | -0.1811 | No | ||
| 9 | NFKB1 | 6591 | 0.610 | -0.1904 | No | ||
| 10 | FADD | 6921 | 0.544 | -0.2037 | No | ||
| 11 | CASP3 | 7517 | 0.422 | -0.2323 | No | ||
| 12 | CASP4 | 7692 | 0.389 | -0.2385 | No | ||
| 13 | BOK | 8504 | 0.223 | -0.2803 | No | ||
| 14 | CASP8 | 9176 | 0.093 | -0.3157 | No | ||
| 15 | CD40LG | 9328 | 0.064 | -0.3233 | No | ||
| 16 | NTRK1 | 9683 | -0.009 | -0.3423 | No | ||
| 17 | NGFR | 10479 | -0.163 | -0.3837 | No | ||
| 18 | CRADD | 11312 | -0.342 | -0.4257 | No | ||
| 19 | DFFB | 11420 | -0.366 | -0.4285 | No | ||
| 20 | DFFA | 12963 | -0.712 | -0.5057 | No | ||
| 21 | TNFRSF1B | 13395 | -0.822 | -0.5222 | No | ||
| 22 | APAF1 | 13413 | -0.827 | -0.5163 | No | ||
| 23 | PTPN13 | 13916 | -0.965 | -0.5355 | No | ||
| 24 | CASP1 | 14210 | -1.049 | -0.5426 | No | ||
| 25 | CASP9 | 16070 | -1.890 | -0.6273 | No | ||
| 26 | TRAF6 | 16659 | -2.353 | -0.6397 | Yes | ||
| 27 | CD40 | 17044 | -2.780 | -0.6376 | Yes | ||
| 28 | DAXX | 17045 | -2.781 | -0.6148 | Yes | ||
| 29 | TRAF2 | 17084 | -2.837 | -0.5937 | Yes | ||
| 30 | BCL2L1 | 17522 | -3.558 | -0.5881 | Yes | ||
| 31 | CASP2 | 17527 | -3.563 | -0.5591 | Yes | ||
| 32 | LTA | 17563 | -3.621 | -0.5314 | Yes | ||
| 33 | NFKBIA | 17567 | -3.627 | -0.5018 | Yes | ||
| 34 | FASLG | 17717 | -3.934 | -0.4777 | Yes | ||
| 35 | BCL2L2 | 17906 | -4.415 | -0.4516 | Yes | ||
| 36 | FAS | 17977 | -4.623 | -0.4176 | Yes | ||
| 37 | IKBKE | 18185 | -5.485 | -0.3838 | Yes | ||
| 38 | TNFRSF1A | 18199 | -5.538 | -0.3392 | Yes | ||
| 39 | MCL1 | 18226 | -5.653 | -0.2943 | Yes | ||
| 40 | CASP6 | 18322 | -6.268 | -0.2481 | Yes | ||
| 41 | TRAF3 | 18385 | -6.833 | -0.1955 | Yes | ||
| 42 | CASP7 | 18463 | -7.844 | -0.1355 | Yes | ||
| 43 | TRAF1 | 18476 | -8.002 | -0.0706 | Yes | ||
| 44 | BCL2 | 18530 | -9.542 | 0.0046 | Yes |
