Profile of the Running ES Score & Positions of GeneSet Members on the Rank Ordered List
| Dataset | set03_wtNotch_versus_normalThy |
| Phenotype | NoPhenotypeAvailable |
| Upregulated in class | na_neg |
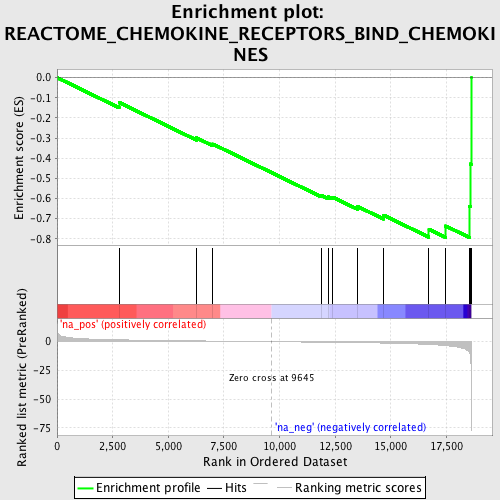
| GeneSet | REACTOME_CHEMOKINE_RECEPTORS_BIND_CHEMOKINES |
| Enrichment Score (ES) | -0.79321724 |
| Normalized Enrichment Score (NES) | -1.8784016 |
| Nominal p-value | 0.0032894737 |
| FDR q-value | 0.1516613 |
| FWER p-Value | 0.709 |
| PROBE | GENE SYMBOL | GENE_TITLE | RANK IN GENE LIST | RANK METRIC SCORE | RUNNING ES | CORE ENRICHMENT | |
|---|---|---|---|---|---|---|---|
| 1 | IL8RB | 2787 | 1.617 | -0.1232 | No | ||
| 2 | CXCL11 | 6263 | 0.675 | -0.2989 | No | ||
| 3 | CCR3 | 6993 | 0.531 | -0.3293 | No | ||
| 4 | CXCR6 | 11886 | -0.470 | -0.5846 | No | ||
| 5 | CCR10 | 12187 | -0.530 | -0.5920 | No | ||
| 6 | IL8RA | 12378 | -0.573 | -0.5928 | No | ||
| 7 | XCR1 | 13511 | -0.852 | -0.6396 | No | ||
| 8 | CX3CL1 | 14670 | -1.188 | -0.6823 | No | ||
| 9 | CCL25 | 16714 | -2.409 | -0.7525 | Yes | ||
| 10 | CCR6 | 17467 | -3.443 | -0.7363 | Yes | ||
| 11 | CCR7 | 18527 | -9.427 | -0.6382 | Yes | ||
| 12 | CCL5 | 18571 | -12.889 | -0.4285 | Yes | ||
| 13 | XCL1 | 18612 | -26.194 | 0.0002 | Yes |
