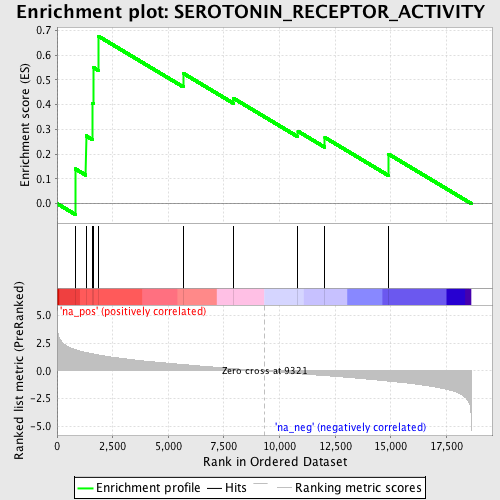
Profile of the Running ES Score & Positions of GeneSet Members on the Rank Ordered List
| Dataset | set03_wtNotch_versus_absentNotch |
| Phenotype | NoPhenotypeAvailable |
| Upregulated in class | na_pos |
| GeneSet | SEROTONIN_RECEPTOR_ACTIVITY |
| Enrichment Score (ES) | 0.67629683 |
| Normalized Enrichment Score (NES) | 1.7342293 |
| Nominal p-value | 0.007889546 |
| FDR q-value | 0.46006697 |
| FWER p-Value | 0.976 |
| PROBE | GENE SYMBOL | GENE_TITLE | RANK IN GENE LIST | RANK METRIC SCORE | RUNNING ES | CORE ENRICHMENT | |
|---|---|---|---|---|---|---|---|
| 1 | HTR5A | 818 | 1.932 | 0.1402 | Yes | ||
| 2 | HTR1D | 1298 | 1.672 | 0.2738 | Yes | ||
| 3 | HTR1B | 1601 | 1.551 | 0.4054 | Yes | ||
| 4 | HTR3B | 1646 | 1.529 | 0.5488 | Yes | ||
| 5 | HTR1F | 1851 | 1.453 | 0.6763 | Yes | ||
| 6 | HTR4 | 5671 | 0.576 | 0.5260 | No | ||
| 7 | HTR7 | 7937 | 0.215 | 0.4247 | No | ||
| 8 | HTR1A | 10826 | -0.238 | 0.2922 | No | ||
| 9 | HTR2A | 12037 | -0.416 | 0.2668 | No | ||
| 10 | HTR2B | 14890 | -0.910 | 0.2002 | No |
