Profile of the Running ES Score & Positions of GeneSet Members on the Rank Ordered List
| Dataset | set03_wtNotch_versus_absentNotch |
| Phenotype | NoPhenotypeAvailable |
| Upregulated in class | na_pos |
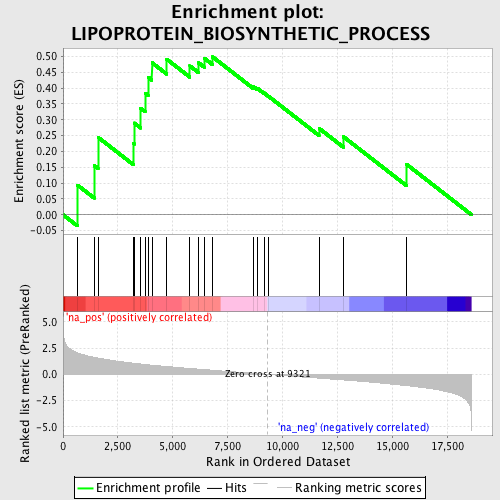
| GeneSet | LIPOPROTEIN_BIOSYNTHETIC_PROCESS |
| Enrichment Score (ES) | 0.49838558 |
| Normalized Enrichment Score (NES) | 1.602243 |
| Nominal p-value | 0.021956088 |
| FDR q-value | 0.5539228 |
| FWER p-Value | 1.0 |
| PROBE | GENE SYMBOL | GENE_TITLE | RANK IN GENE LIST | RANK METRIC SCORE | RUNNING ES | CORE ENRICHMENT | |
|---|---|---|---|---|---|---|---|
| 1 | AIPL1 | 654 | 2.038 | 0.0939 | Yes | ||
| 2 | PIGT | 1418 | 1.623 | 0.1556 | Yes | ||
| 3 | FNTB | 1596 | 1.554 | 0.2445 | Yes | ||
| 4 | PIGA | 3209 | 1.058 | 0.2248 | Yes | ||
| 5 | PIGO | 3239 | 1.051 | 0.2897 | Yes | ||
| 6 | CHM | 3537 | 0.980 | 0.3358 | Yes | ||
| 7 | PIGS | 3739 | 0.935 | 0.3842 | Yes | ||
| 8 | DPM2 | 3876 | 0.906 | 0.4342 | Yes | ||
| 9 | DPM1 | 4051 | 0.871 | 0.4800 | Yes | ||
| 10 | PIGH | 4723 | 0.743 | 0.4909 | Yes | ||
| 11 | FNTA | 5778 | 0.561 | 0.4698 | Yes | ||
| 12 | PIGF | 6178 | 0.492 | 0.4795 | Yes | ||
| 13 | APOA2 | 6433 | 0.448 | 0.4942 | Yes | ||
| 14 | PIGK | 6812 | 0.387 | 0.4984 | Yes | ||
| 15 | PGGT1B | 8660 | 0.099 | 0.4053 | No | ||
| 16 | PIGB | 8872 | 0.065 | 0.3981 | No | ||
| 17 | PIGC | 9156 | 0.025 | 0.3845 | No | ||
| 18 | GPAA1 | 9357 | -0.007 | 0.3742 | No | ||
| 19 | APOA1 | 11666 | -0.360 | 0.2729 | No | ||
| 20 | DPM3 | 12773 | -0.526 | 0.2467 | No | ||
| 21 | ATG7 | 15658 | -1.066 | 0.1591 | No |
