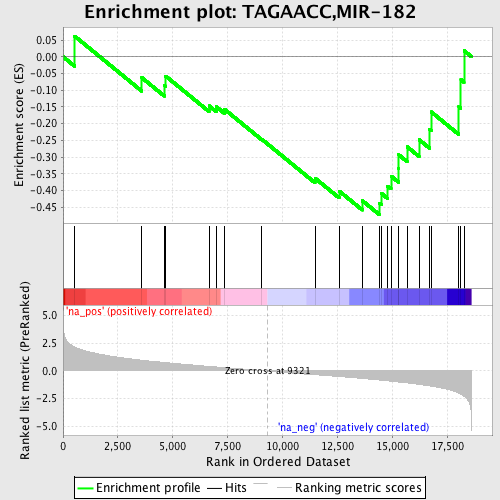
Profile of the Running ES Score & Positions of GeneSet Members on the Rank Ordered List
| Dataset | set03_wtNotch_versus_absentNotch |
| Phenotype | NoPhenotypeAvailable |
| Upregulated in class | na_neg |
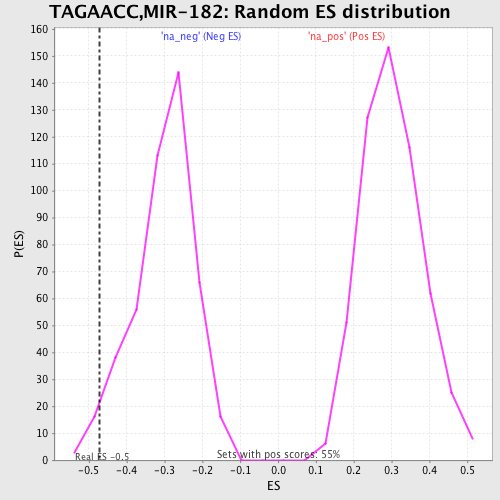
| GeneSet | TAGAACC,MIR-182 |
| Enrichment Score (ES) | -0.47182944 |
| Normalized Enrichment Score (NES) | -1.5627714 |
| Nominal p-value | 0.022123894 |
| FDR q-value | 0.27925414 |
| FWER p-Value | 0.867 |
| PROBE | GENE SYMBOL | GENE_TITLE | RANK IN GENE LIST | RANK METRIC SCORE | RUNNING ES | CORE ENRICHMENT | |
|---|---|---|---|---|---|---|---|
| 1 | HOXB4 | 525 | 2.164 | 0.0618 | No | ||
| 2 | NUP153 | 3586 | 0.969 | -0.0625 | No | ||
| 3 | FUSIP1 | 4613 | 0.765 | -0.0858 | No | ||
| 4 | CREM | 4672 | 0.753 | -0.0576 | No | ||
| 5 | ACYP1 | 6654 | 0.416 | -0.1468 | No | ||
| 6 | CXXC5 | 6987 | 0.360 | -0.1497 | No | ||
| 7 | UBE2B | 7349 | 0.300 | -0.1567 | No | ||
| 8 | FLI1 | 9059 | 0.040 | -0.2469 | No | ||
| 9 | SLC16A7 | 11483 | -0.335 | -0.3633 | No | ||
| 10 | DOCK9 | 12581 | -0.495 | -0.4017 | No | ||
| 11 | SFRS1 | 13638 | -0.672 | -0.4305 | No | ||
| 12 | CRIM1 | 14407 | -0.811 | -0.4381 | Yes | ||
| 13 | HDHD2 | 14506 | -0.832 | -0.4088 | Yes | ||
| 14 | RAB5A | 14787 | -0.888 | -0.3869 | Yes | ||
| 15 | BAAT | 14948 | -0.922 | -0.3571 | Yes | ||
| 16 | RNF6 | 15288 | -0.990 | -0.3341 | Yes | ||
| 17 | ZFP36L2 | 15298 | -0.992 | -0.2933 | Yes | ||
| 18 | DDX3X | 15680 | -1.071 | -0.2692 | Yes | ||
| 19 | TBR1 | 16226 | -1.210 | -0.2482 | Yes | ||
| 20 | CNTN2 | 16708 | -1.346 | -0.2181 | Yes | ||
| 21 | GALNT1 | 16777 | -1.366 | -0.1649 | Yes | ||
| 22 | BCL2L2 | 18037 | -1.986 | -0.1500 | Yes | ||
| 23 | RBM12 | 18132 | -2.081 | -0.0684 | Yes | ||
| 24 | SLC6A4 | 18273 | -2.268 | 0.0184 | Yes |