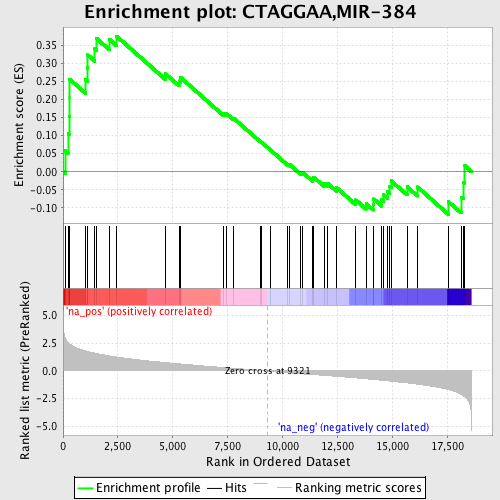
Profile of the Running ES Score & Positions of GeneSet Members on the Rank Ordered List
| Dataset | set03_wtNotch_versus_absentNotch |
| Phenotype | NoPhenotypeAvailable |
| Upregulated in class | na_pos |
| GeneSet | CTAGGAA,MIR-384 |
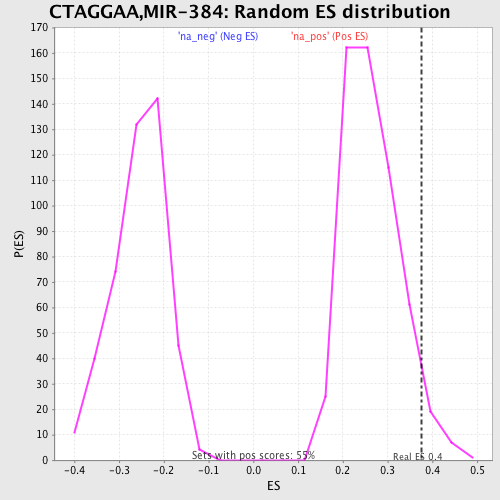
| Enrichment Score (ES) | 0.37509462 |
| Normalized Enrichment Score (NES) | 1.417557 |
| Nominal p-value | 0.04347826 |
| FDR q-value | 0.51715267 |
| FWER p-Value | 1.0 |
| PROBE | GENE SYMBOL | GENE_TITLE | RANK IN GENE LIST | RANK METRIC SCORE | RUNNING ES | CORE ENRICHMENT | |
|---|---|---|---|---|---|---|---|
| 1 | UBE2E3 | 95 | 3.007 | 0.0580 | Yes | ||
| 2 | ERBB2IP | 226 | 2.574 | 0.1051 | Yes | ||
| 3 | MOSPD1 | 286 | 2.464 | 0.1537 | Yes | ||
| 4 | SLC39A14 | 296 | 2.449 | 0.2046 | Yes | ||
| 5 | BRE | 298 | 2.446 | 0.2559 | Yes | ||
| 6 | PTGER2 | 1024 | 1.805 | 0.2548 | Yes | ||
| 7 | DCTN5 | 1108 | 1.756 | 0.2872 | Yes | ||
| 8 | POM121 | 1124 | 1.748 | 0.3231 | Yes | ||
| 9 | GTF2B | 1446 | 1.614 | 0.3397 | Yes | ||
| 10 | ATP2C1 | 1519 | 1.585 | 0.3691 | Yes | ||
| 11 | SIX4 | 2101 | 1.366 | 0.3665 | Yes | ||
| 12 | EXOC5 | 2434 | 1.260 | 0.3751 | Yes | ||
| 13 | CHES1 | 4663 | 0.755 | 0.2710 | No | ||
| 14 | RIMS4 | 5285 | 0.643 | 0.2511 | No | ||
| 15 | NLK | 5345 | 0.634 | 0.2612 | No | ||
| 16 | YY1 | 7320 | 0.305 | 0.1613 | No | ||
| 17 | SFRS7 | 7432 | 0.287 | 0.1614 | No | ||
| 18 | ARFIP2 | 7764 | 0.240 | 0.1486 | No | ||
| 19 | VDP | 8991 | 0.050 | 0.0836 | No | ||
| 20 | GFRA2 | 9057 | 0.040 | 0.0810 | No | ||
| 21 | EPC2 | 9446 | -0.019 | 0.0605 | No | ||
| 22 | CUGBP2 | 10245 | -0.149 | 0.0206 | No | ||
| 23 | PICALM | 10336 | -0.162 | 0.0192 | No | ||
| 24 | SYTL2 | 10818 | -0.237 | -0.0017 | No | ||
| 25 | SLC35F1 | 10922 | -0.256 | -0.0019 | No | ||
| 26 | PTN | 11385 | -0.323 | -0.0200 | No | ||
| 27 | UNC5C | 11418 | -0.326 | -0.0149 | No | ||
| 28 | GPM6B | 11894 | -0.394 | -0.0322 | No | ||
| 29 | GPR83 | 12046 | -0.417 | -0.0315 | No | ||
| 30 | CHRD | 12458 | -0.476 | -0.0437 | No | ||
| 31 | HDGF | 13339 | -0.619 | -0.0781 | No | ||
| 32 | ESRRG | 13806 | -0.702 | -0.0884 | No | ||
| 33 | RIMS2 | 14130 | -0.761 | -0.0898 | No | ||
| 34 | LAMC1 | 14160 | -0.765 | -0.0753 | No | ||
| 35 | AQP4 | 14525 | -0.835 | -0.0774 | No | ||
| 36 | THBD | 14606 | -0.851 | -0.0638 | No | ||
| 37 | HAO1 | 14789 | -0.888 | -0.0549 | No | ||
| 38 | ACVR1 | 14876 | -0.909 | -0.0405 | No | ||
| 39 | PRKACB | 14950 | -0.923 | -0.0250 | No | ||
| 40 | DDX3X | 15680 | -1.071 | -0.0418 | No | ||
| 41 | IL17RC | 16151 | -1.191 | -0.0421 | No | ||
| 42 | ELL3 | 17565 | -1.676 | -0.0830 | No | ||
| 43 | METAP2 | 18143 | -2.096 | -0.0700 | No | ||
| 44 | NCAM1 | 18242 | -2.217 | -0.0288 | No | ||
| 45 | CD200 | 18311 | -2.326 | 0.0164 | No |