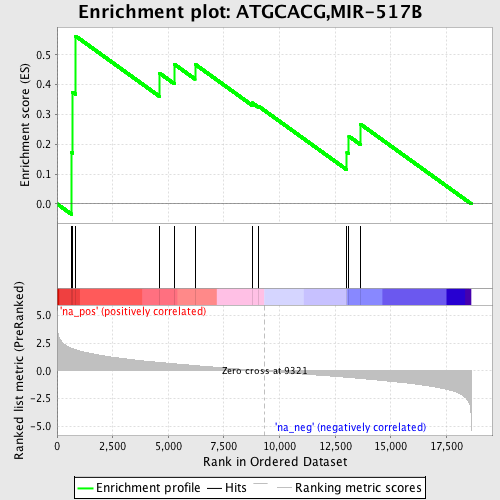
Profile of the Running ES Score & Positions of GeneSet Members on the Rank Ordered List
| Dataset | set03_wtNotch_versus_absentNotch |
| Phenotype | NoPhenotypeAvailable |
| Upregulated in class | na_pos |
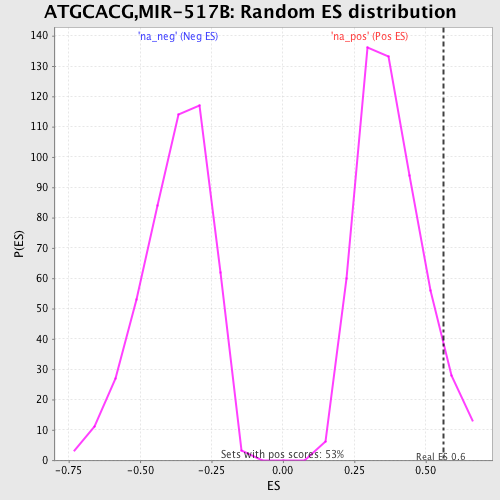
| GeneSet | ATGCACG,MIR-517B |
| Enrichment Score (ES) | 0.562953 |
| Normalized Enrichment Score (NES) | 1.485413 |
| Nominal p-value | 0.06273764 |
| FDR q-value | 0.47502825 |
| FWER p-Value | 0.998 |
| PROBE | GENE SYMBOL | GENE_TITLE | RANK IN GENE LIST | RANK METRIC SCORE | RUNNING ES | CORE ENRICHMENT | |
|---|---|---|---|---|---|---|---|
| 1 | CABP7 | 659 | 2.034 | 0.1721 | Yes | ||
| 2 | NRXN1 | 697 | 2.006 | 0.3749 | Yes | ||
| 3 | TBX15 | 837 | 1.916 | 0.5630 | Yes | ||
| 4 | FUSIP1 | 4613 | 0.765 | 0.4381 | No | ||
| 5 | LASS1 | 5274 | 0.645 | 0.4685 | No | ||
| 6 | NR4A3 | 6198 | 0.489 | 0.4687 | No | ||
| 7 | MORF4L2 | 8773 | 0.083 | 0.3389 | No | ||
| 8 | CAMK2G | 9064 | 0.040 | 0.3273 | No | ||
| 9 | MORF4L1 | 13027 | -0.569 | 0.1725 | No | ||
| 10 | PRDM8 | 13117 | -0.581 | 0.2270 | No | ||
| 11 | SFRS1 | 13638 | -0.672 | 0.2675 | No |