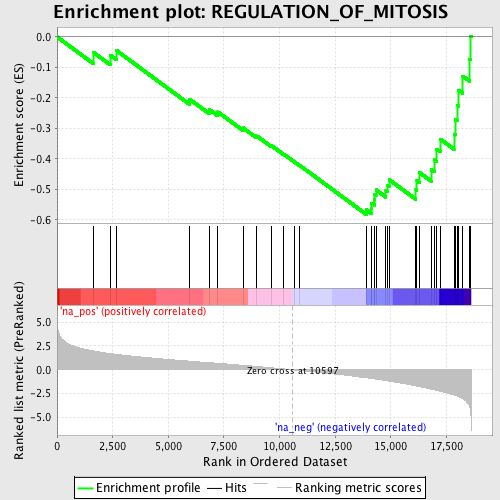
Profile of the Running ES Score & Positions of GeneSet Members on the Rank Ordered List
| Dataset | set03_truncNotch_versus_wtNotch |
| Phenotype | NoPhenotypeAvailable |
| Upregulated in class | na_neg |
| GeneSet | REGULATION_OF_MITOSIS |
| Enrichment Score (ES) | -0.5826394 |
| Normalized Enrichment Score (NES) | -2.1715417 |
| Nominal p-value | 0.0 |
| FDR q-value | 0.0035254192 |
| FWER p-Value | 0.022 |
| PROBE | GENE SYMBOL | GENE_TITLE | RANK IN GENE LIST | RANK METRIC SCORE | RUNNING ES | CORE ENRICHMENT | |
|---|---|---|---|---|---|---|---|
| 1 | PML | 1644 | 1.966 | -0.0516 | No | ||
| 2 | MAD2L2 | 2384 | 1.691 | -0.0596 | No | ||
| 3 | NEK2 | 2671 | 1.615 | -0.0447 | No | ||
| 4 | NEK6 | 5956 | 0.899 | -0.2045 | No | ||
| 5 | CDKN2B | 6856 | 0.733 | -0.2391 | No | ||
| 6 | CD28 | 7225 | 0.675 | -0.2463 | No | ||
| 7 | TGFB1 | 8358 | 0.463 | -0.2985 | No | ||
| 8 | PRMT5 | 8974 | 0.349 | -0.3250 | No | ||
| 9 | RCC1 | 9622 | 0.206 | -0.3560 | No | ||
| 10 | BUB1 | 10189 | 0.087 | -0.3848 | No | ||
| 11 | UBE2C | 10662 | -0.017 | -0.4099 | No | ||
| 12 | EREG | 10902 | -0.073 | -0.4214 | No | ||
| 13 | CDC23 | 13900 | -0.834 | -0.5670 | Yes | ||
| 14 | ATM | 14127 | -0.911 | -0.5620 | Yes | ||
| 15 | BIRC5 | 14134 | -0.913 | -0.5452 | Yes | ||
| 16 | NPM2 | 14257 | -0.950 | -0.5339 | Yes | ||
| 17 | TTK | 14282 | -0.959 | -0.5172 | Yes | ||
| 18 | EPGN | 14336 | -0.975 | -0.5018 | Yes | ||
| 19 | CDC16 | 14779 | -1.128 | -0.5044 | Yes | ||
| 20 | KNTC1 | 14846 | -1.150 | -0.4863 | Yes | ||
| 21 | PCBP4 | 14926 | -1.177 | -0.4685 | Yes | ||
| 22 | PIN1 | 16127 | -1.683 | -0.5015 | Yes | ||
| 23 | ZWINT | 16172 | -1.700 | -0.4719 | Yes | ||
| 24 | CDC25C | 16298 | -1.762 | -0.4456 | Yes | ||
| 25 | ZW10 | 16818 | -2.028 | -0.4354 | Yes | ||
| 26 | CHFR | 16958 | -2.095 | -0.4036 | Yes | ||
| 27 | RAD17 | 17065 | -2.152 | -0.3689 | Yes | ||
| 28 | NBN | 17226 | -2.246 | -0.3353 | Yes | ||
| 29 | BUB1B | 17842 | -2.637 | -0.3189 | Yes | ||
| 30 | MAD2L1 | 17898 | -2.685 | -0.2715 | Yes | ||
| 31 | NUSAP1 | 17980 | -2.749 | -0.2242 | Yes | ||
| 32 | EGF | 18031 | -2.793 | -0.1745 | Yes | ||
| 33 | CCNA2 | 18230 | -3.023 | -0.1284 | Yes | ||
| 34 | ANLN | 18546 | -3.873 | -0.0726 | Yes | ||
| 35 | TGFA | 18567 | -4.065 | 0.0026 | Yes |
